
 Yahoo Finance
 Eumundi Group Limited's (ASX:EBG) Stock Financial Prospects Look Bleak: Should Shareholders Be Prepared For A Share Price Correction?
Eumundi Group's (ASX:EBG) stock is up by 4.4% over the past month. However, its weak financial performance indicators makes us a bit doubtful if that trend could continue. In this article, we decided to focus on Eumundi Group's ROE.
ROE or return on equity is a useful tool to assess how effectively a company can generate returns on the investment it received from its shareholders. Simply put, it is used to assess the profitability of a company in relation to its equity capital.
Check out our latest analysis for Eumundi Group
How Is ROE Calculated?
The formula for return on equity is:
Return on Equity = Net Profit (from continuing operations) ÷ Shareholders' Equity
So, based on the above formula, the ROE for Eumundi Group is:
2.4% = AU$948k ÷ AU$39m (Based on the trailing twelve months to December 2020).
The 'return' refers to a company's earnings over the last year. That means that for every A$1 worth of shareholders' equity, the company generated A$0.02 in profit.
What Is The Relationship Between ROE And Earnings Growth?
Thus far, we have learned that ROE measures how efficiently a company is generating its profits. Depending on how much of these profits the company reinvests or "retains", and how effectively it does so, we are then able to assess a company’s earnings growth potential. Assuming everything else remains unchanged, the higher the ROE and profit retention, the higher the growth rate of a company compared to companies that don't necessarily bear these characteristics.
Eumundi Group's Earnings Growth And 2.4% ROE
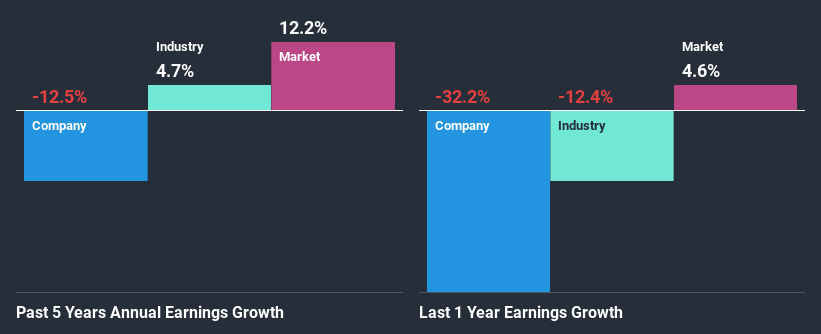
As you can see, Eumundi Group's ROE looks pretty weak. Not just that, even compared to the industry average of 7.6%, the company's ROE is entirely unremarkable. Given the circumstances, the significant decline in net income by 12% seen by Eumundi Group over the last five years is not surprising. We believe that there also might be other aspects that are negatively influencing the company's earnings prospects. Such as - low earnings retention or poor allocation of capital.
That being said, we compared Eumundi Group's performance with the industry and were concerned when we found that while the company has shrunk its earnings, the industry has grown its earnings at a rate of 4.7% in the same period.
Earnings growth is a huge factor in stock valuation. The investor should try to establish if the expected growth or decline in earnings, whichever the case may be, is priced in. Doing so will help them establish if the stock's future looks promising or ominous. One good indicator of expected earnings growth is the P/E ratio which determines the price the market is willing to pay for a stock based on its earnings prospects. So, you may want to check if Eumundi Group is trading on a high P/E or a low P/E, relative to its industry.
Is Eumundi Group Efficiently Re-investing Its Profits?
While the company did payout a portion of its dividend in the past, it currently doesn't pay a dividend. This implies that potentially all of its profits are being reinvested in the business.
Summary
On the whole, Eumundi Group's performance is quite a big let-down. Because the company is not reinvesting much into the business, and given the low ROE, it's not surprising to see the lack or absence of growth in its earnings. Up till now, we've only made a short study of the company's growth data. So it may be worth checking this free detailed graph of Eumundi Group's past earnings, as well as revenue and cash flows to get a deeper insight into the company's performance.
This article by Simply Wall St is general in nature. It does not constitute a recommendation to buy or sell any stock, and does not take account of your objectives, or your financial situation. We aim to bring you long-term focused analysis driven by fundamental data. Note that our analysis may not factor in the latest price-sensitive company announcements or qualitative material. Simply Wall St has no position in any stocks mentioned.
Have feedback on this article? Concerned about the content? Get in touch with us directly. Alternatively, email editorial-team (at) simplywallst.com.