
 Yahoo Finance
 Enphase Energy (NASDAQ:ENPH) Hasn't Managed To Accelerate Its Returns
If we want to find a potential multi-bagger, often there are underlying trends that can provide clues. Typically, we'll want to notice a trend of growing return on capital employed (ROCE) and alongside that, an expanding base of capital employed. Put simply, these types of businesses are compounding machines, meaning they are continually reinvesting their earnings at ever-higher rates of return. However, after briefly looking over the numbers, we don't think Enphase Energy (NASDAQ:ENPH) has the makings of a multi-bagger going forward, but let's have a look at why that may be.
Return On Capital Employed (ROCE): What Is It?
For those that aren't sure what ROCE is, it measures the amount of pre-tax profits a company can generate from the capital employed in its business. To calculate this metric for Enphase Energy, this is the formula:
Return on Capital Employed = Earnings Before Interest and Tax (EBIT) ÷ (Total Assets - Current Liabilities)
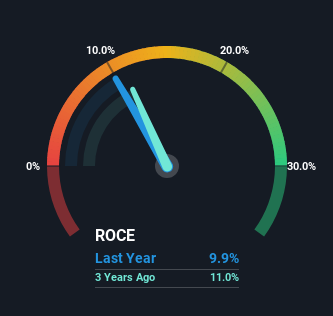
0.099 = US$266m ÷ (US$3.2b - US$554m) (Based on the trailing twelve months to March 2024).
So, Enphase Energy has an ROCE of 9.9%. Even though it's in line with the industry average of 9.7%, it's still a low return by itself.
Check out our latest analysis for Enphase Energy
In the above chart we have measured Enphase Energy's prior ROCE against its prior performance, but the future is arguably more important. If you'd like, you can check out the forecasts from the analysts covering Enphase Energy for free.
So How Is Enphase Energy's ROCE Trending?
There are better returns on capital out there than what we're seeing at Enphase Energy. The company has consistently earned 9.9% for the last five years, and the capital employed within the business has risen 1,306% in that time. Given the company has increased the amount of capital employed, it appears the investments that have been made simply don't provide a high return on capital.
On a side note, Enphase Energy has done well to reduce current liabilities to 17% of total assets over the last five years. This can eliminate some of the risks inherent in the operations because the business has less outstanding obligations to their suppliers and or short-term creditors than they did previously.
The Bottom Line On Enphase Energy's ROCE
As we've seen above, Enphase Energy's returns on capital haven't increased but it is reinvesting in the business. Investors must think there's better things to come because the stock has knocked it out of the park, delivering a 671% gain to shareholders who have held over the last five years. However, unless these underlying trends turn more positive, we wouldn't get our hopes up too high.
One more thing, we've spotted 1 warning sign facing Enphase Energy that you might find interesting.
If you want to search for solid companies with great earnings, check out this free list of companies with good balance sheets and impressive returns on equity.
Have feedback on this article? Concerned about the content? Get in touch with us directly. Alternatively, email editorial-team (at) simplywallst.com.
This article by Simply Wall St is general in nature. We provide commentary based on historical data and analyst forecasts only using an unbiased methodology and our articles are not intended to be financial advice. It does not constitute a recommendation to buy or sell any stock, and does not take account of your objectives, or your financial situation. We aim to bring you long-term focused analysis driven by fundamental data. Note that our analysis may not factor in the latest price-sensitive company announcements or qualitative material. Simply Wall St has no position in any stocks mentioned.
