
 Yahoo Finance
 The Energy World (ASX:EWC) Share Price Is Up 76% And Shareholders Are Holding On
It might be of some concern to shareholders to see the Energy World Corporation Ltd (ASX:EWC) share price down 18% in the last month. But looking back over the last year, the returns have actually been rather pleasing! To wit, it had solidly beat the market, up 76%.
View our latest analysis for Energy World
While the efficient markets hypothesis continues to be taught by some, it has been proven that markets are over-reactive dynamic systems, and investors are not always rational. One imperfect but simple way to consider how the market perception of a company has shifted is to compare the change in the earnings per share (EPS) with the share price movement.
During the last year, Energy World actually saw its earnings per share drop 71%.
Given the share price gain, we doubt the market is measuring progress with EPS. Indeed, when EPS is declining but the share price is up, it often means the market is considering other factors.
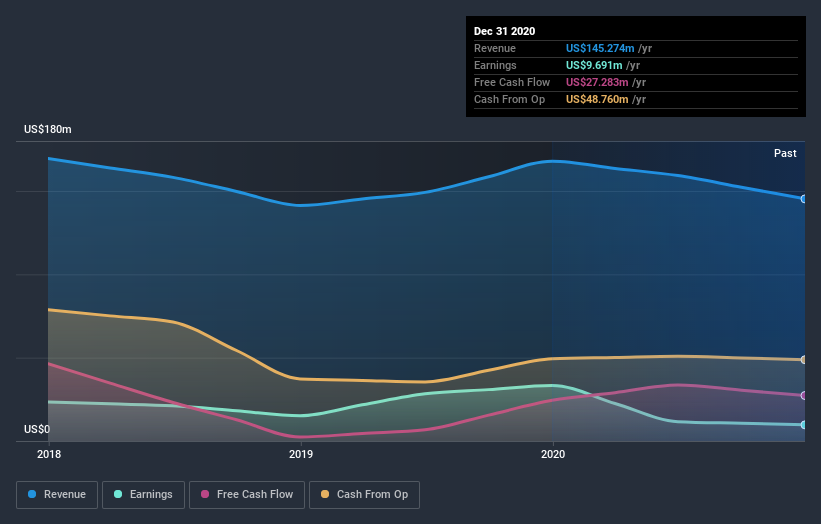
Energy World's revenue actually dropped 13% over last year. So using a snapshot of key business metrics doesn't give us a good picture of why the market is bidding up the stock.
The company's revenue and earnings (over time) are depicted in the image below (click to see the exact numbers).
You can see how its balance sheet has strengthened (or weakened) over time in this free interactive graphic.
What about the Total Shareholder Return (TSR)?
We'd be remiss not to mention the difference between Energy World's total shareholder return (TSR) and its share price return. Arguably the TSR is a more complete return calculation because it accounts for the value of dividends (as if they were reinvested), along with the hypothetical value of any discounted capital that have been offered to shareholders. Energy World hasn't been paying dividends, but its TSR of 88% exceeds its share price return of 76%, implying it has either spun-off a business, or raised capital at a discount; thereby providing additional value to shareholders.
A Different Perspective
It's nice to see that Energy World shareholders have received a total shareholder return of 88% over the last year. There's no doubt those recent returns are much better than the TSR loss of 9% per year over five years. This makes us a little wary, but the business might have turned around its fortunes. I find it very interesting to look at share price over the long term as a proxy for business performance. But to truly gain insight, we need to consider other information, too. Even so, be aware that Energy World is showing 4 warning signs in our investment analysis , and 2 of those are a bit concerning...
For those who like to find winning investments this free list of growing companies with recent insider purchasing, could be just the ticket.
Please note, the market returns quoted in this article reflect the market weighted average returns of stocks that currently trade on AU exchanges.
This article by Simply Wall St is general in nature. It does not constitute a recommendation to buy or sell any stock, and does not take account of your objectives, or your financial situation. We aim to bring you long-term focused analysis driven by fundamental data. Note that our analysis may not factor in the latest price-sensitive company announcements or qualitative material. Simply Wall St has no position in any stocks mentioned.
Have feedback on this article? Concerned about the content? Get in touch with us directly. Alternatively, email editorial-team (at) simplywallst.com.
