
 Yahoo Finance
 Empire Energy Group (ASX:EEG) shareholders have endured a 64% loss from investing in the stock three years ago
If you love investing in stocks you're bound to buy some losers. But the long term shareholders of Empire Energy Group Limited (ASX:EEG) have had an unfortunate run in the last three years. Regrettably, they have had to cope with a 64% drop in the share price over that period. And over the last year the share price fell 30%, so we doubt many shareholders are delighted. Shareholders have had an even rougher run lately, with the share price down 10% in the last 90 days. Of course, this share price action may well have been influenced by the 4.5% decline in the broader market, throughout the period.
So let's have a look and see if the longer term performance of the company has been in line with the underlying business' progress.
See our latest analysis for Empire Energy Group
Given that Empire Energy Group didn't make a profit in the last twelve months, we'll focus on revenue growth to form a quick view of its business development. Shareholders of unprofitable companies usually expect strong revenue growth. That's because it's hard to be confident a company will be sustainable if revenue growth is negligible, and it never makes a profit.
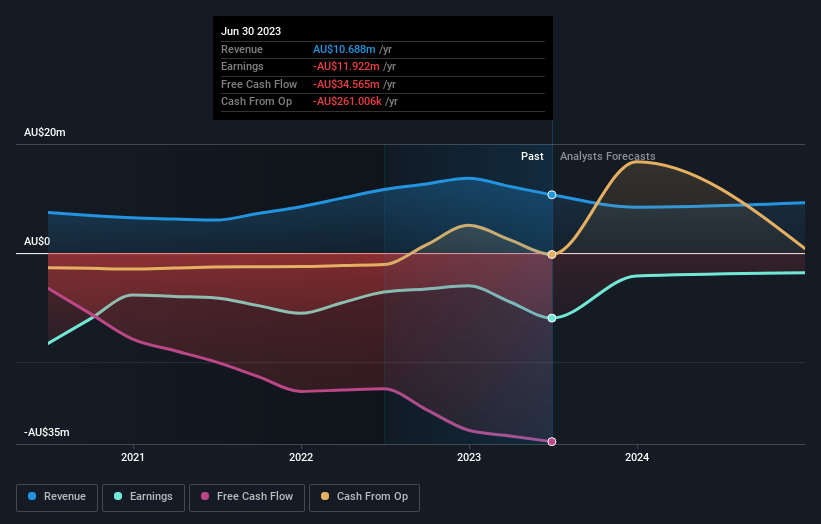
In the last three years, Empire Energy Group saw its revenue grow by 26% per year, compound. That is faster than most pre-profit companies. The share price has moved in quite the opposite direction, down 18% over that time, a bad result. This could mean hype has come out of the stock because the losses are concerning investors. But a share price drop of that magnitude could well signal that the market is overly negative on the stock.
You can see below how earnings and revenue have changed over time (discover the exact values by clicking on the image).
This free interactive report on Empire Energy Group's balance sheet strength is a great place to start, if you want to investigate the stock further.
A Different Perspective
Investors in Empire Energy Group had a tough year, with a total loss of 30%, against a market gain of about 4.8%. Even the share prices of good stocks drop sometimes, but we want to see improvements in the fundamental metrics of a business, before getting too interested. Regrettably, last year's performance caps off a bad run, with the shareholders facing a total loss of 3% per year over five years. We realise that Baron Rothschild has said investors should "buy when there is blood on the streets", but we caution that investors should first be sure they are buying a high quality business. I find it very interesting to look at share price over the long term as a proxy for business performance. But to truly gain insight, we need to consider other information, too. Even so, be aware that Empire Energy Group is showing 3 warning signs in our investment analysis , and 1 of those doesn't sit too well with us...
If you like to buy stocks alongside management, then you might just love this free list of companies. (Hint: insiders have been buying them).
Please note, the market returns quoted in this article reflect the market weighted average returns of stocks that currently trade on Australian exchanges.
Have feedback on this article? Concerned about the content? Get in touch with us directly. Alternatively, email editorial-team (at) simplywallst.com.
This article by Simply Wall St is general in nature. We provide commentary based on historical data and analyst forecasts only using an unbiased methodology and our articles are not intended to be financial advice. It does not constitute a recommendation to buy or sell any stock, and does not take account of your objectives, or your financial situation. We aim to bring you long-term focused analysis driven by fundamental data. Note that our analysis may not factor in the latest price-sensitive company announcements or qualitative material. Simply Wall St has no position in any stocks mentioned.
