
 Yahoo Finance
 Embelton (ASX:EMB) Will Be Hoping To Turn Its Returns On Capital Around
To find a multi-bagger stock, what are the underlying trends we should look for in a business? Firstly, we'll want to see a proven return on capital employed (ROCE) that is increasing, and secondly, an expanding base of capital employed. Basically this means that a company has profitable initiatives that it can continue to reinvest in, which is a trait of a compounding machine. Although, when we looked at Embelton (ASX:EMB), it didn't seem to tick all of these boxes.
Return On Capital Employed (ROCE): What is it?
For those who don't know, ROCE is a measure of a company's yearly pre-tax profit (its return), relative to the capital employed in the business. To calculate this metric for Embelton, this is the formula:
Return on Capital Employed = Earnings Before Interest and Tax (EBIT) ÷ (Total Assets - Current Liabilities)
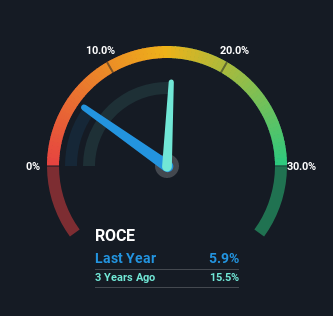
0.059 = AU$1.4m ÷ (AU$36m - AU$12m) (Based on the trailing twelve months to December 2021).
Therefore, Embelton has an ROCE of 5.9%. Ultimately, that's a low return and it under-performs the Building industry average of 11%.
Check out our latest analysis for Embelton
While the past is not representative of the future, it can be helpful to know how a company has performed historically, which is why we have this chart above. If you'd like to look at how Embelton has performed in the past in other metrics, you can view this free graph of past earnings, revenue and cash flow.
What Does the ROCE Trend For Embelton Tell Us?
On the surface, the trend of ROCE at Embelton doesn't inspire confidence. Around five years ago the returns on capital were 19%, but since then they've fallen to 5.9%. Given the business is employing more capital while revenue has slipped, this is a bit concerning. If this were to continue, you might be looking at a company that is trying to reinvest for growth but is actually losing market share since sales haven't increased.
Our Take On Embelton's ROCE
In summary, we're somewhat concerned by Embelton's diminishing returns on increasing amounts of capital. And, the stock has remained flat over the last five years, so investors don't seem too impressed either. With underlying trends that aren't great in these areas, we'd consider looking elsewhere.
One final note, you should learn about the 5 warning signs we've spotted with Embelton (including 2 which don't sit too well with us) .
While Embelton may not currently earn the highest returns, we've compiled a list of companies that currently earn more than 25% return on equity. Check out this free list here.
Have feedback on this article? Concerned about the content? Get in touch with us directly. Alternatively, email editorial-team (at) simplywallst.com.
This article by Simply Wall St is general in nature. We provide commentary based on historical data and analyst forecasts only using an unbiased methodology and our articles are not intended to be financial advice. It does not constitute a recommendation to buy or sell any stock, and does not take account of your objectives, or your financial situation. We aim to bring you long-term focused analysis driven by fundamental data. Note that our analysis may not factor in the latest price-sensitive company announcements or qualitative material. Simply Wall St has no position in any stocks mentioned.
