
 Yahoo Finance
 Are Eltek Ltd’s (NASDAQ:ELTK) Interest Costs Too High?

Investors are always looking for growth in small-cap stocks like Eltek Ltd (NASDAQ:ELTK), with a market cap of US$8.70M. However, an important fact which most ignore is: how financially healthy is the business? Electronic companies, in particular ones that run negative earnings, tend to be high risk. Evaluating financial health as part of your investment thesis is crucial. I believe these basic checks tell most of the story you need to know. Nevertheless, since I only look at basic financial figures, I recommend you dig deeper yourself into ELTK here.
How does ELTK’s operating cash flow stack up against its debt?
ELTK’s debt levels surged from US$4.82M to US$8.89M over the last 12 months , which comprises of short- and long-term debt. With this rise in debt, the current cash and short-term investment levels stands at US$887.00K , ready to deploy into the business. Moving onto cash from operations, its operating cash flow is not yet significant enough to calculate a meaningful cash-to-debt ratio, indicating that operational efficiency is something we’d need to take a look at. For this article’s sake, I won’t be looking at this today, but you can assess some of ELTK’s operating efficiency ratios such as ROA here.
Can ELTK pay its short-term liabilities?
With current liabilities at US$18.07M, it appears that the company has not maintained a sufficient level of current assets to meet its obligations, with the current ratio last standing at 0.75x, which is below the prudent industry ratio of 3x.
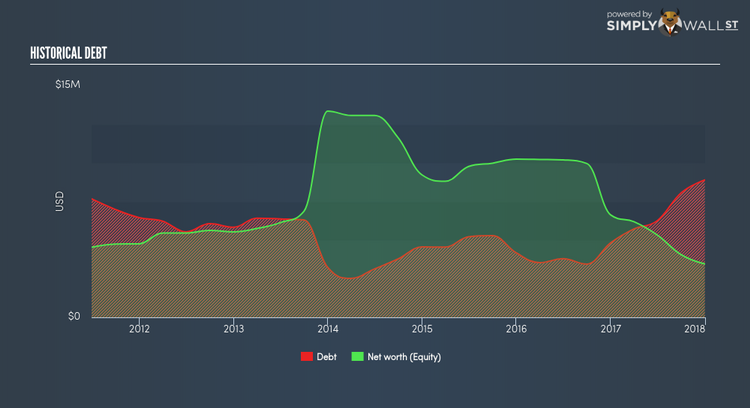
Can ELTK service its debt comfortably?
ELTK is a highly-leveraged company with debt exceeding equity by over 100%. This is not unusual for small-caps as debt tends to be a cheaper and faster source of funding for some businesses. However, since ELTK is presently loss-making, sustainability of its current state of operations becomes a concern. Maintaining a high level of debt, while revenues are still below costs, can be dangerous as liquidity tends to dry up in unexpected downturns.
Next Steps:
ELTK’s high debt level indicates room for improvement. Furthermore, its cash flow coverage of less than a quarter of debt means that operating efficiency could also be an issue. In addition to this, its lack of liquidity raises questions over current asset management practices for the small-cap. This is only a rough assessment of financial health, and I’m sure ELTK has company-specific issues impacting its capital structure decisions. I suggest you continue to research Eltek to get a more holistic view of the stock by looking at:
Historical Performance: What has ELTK’s returns been like over the past? Go into more detail in the past track record analysis and take a look at the free visual representations of our analysis for more clarity.
Other High-Performing Stocks: Are there other stocks that provide better prospects with proven track records? Explore our free list of these great stocks here.
To help readers see pass the short term volatility of the financial market, we aim to bring you a long-term focused research analysis purely driven by fundamental data. Note that our analysis does not factor in the latest price sensitive company announcements.
The author is an independent contributor and at the time of publication had no position in the stocks mentioned.
