
 Yahoo Finance
 eGain (NASDAQ:EGAN) Is Looking To Continue Growing Its Returns On Capital
If we want to find a stock that could multiply over the long term, what are the underlying trends we should look for? Firstly, we'll want to see a proven return on capital employed (ROCE) that is increasing, and secondly, an expanding base of capital employed. If you see this, it typically means it's a company with a great business model and plenty of profitable reinvestment opportunities. So on that note, eGain (NASDAQ:EGAN) looks quite promising in regards to its trends of return on capital.
Understanding Return On Capital Employed (ROCE)
For those that aren't sure what ROCE is, it measures the amount of pre-tax profits a company can generate from the capital employed in its business. To calculate this metric for eGain, this is the formula:
Return on Capital Employed = Earnings Before Interest and Tax (EBIT) ÷ (Total Assets - Current Liabilities)
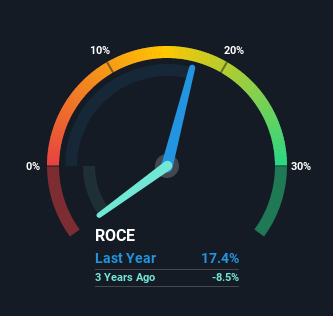
0.17 = US$8.4m ÷ (US$93m - US$45m) (Based on the trailing twelve months to March 2021).
So, eGain has an ROCE of 17%. In absolute terms, that's a satisfactory return, but compared to the Software industry average of 10% it's much better.
Check out our latest analysis for eGain
Above you can see how the current ROCE for eGain compares to its prior returns on capital, but there's only so much you can tell from the past. If you'd like, you can check out the forecasts from the analysts covering eGain here for free.
So How Is eGain's ROCE Trending?
The fact that eGain is now generating some pre-tax profits from its prior investments is very encouraging. The company was generating losses five years ago, but now it's earning 17% which is a sight for sore eyes. And unsurprisingly, like most companies trying to break into the black, eGain is utilizing 157% more capital than it was five years ago. This can indicate that there's plenty of opportunities to invest capital internally and at ever higher rates, both common traits of a multi-bagger.
On a separate but related note, it's important to know that eGain has a current liabilities to total assets ratio of 48%, which we'd consider pretty high. This effectively means that suppliers (or short-term creditors) are funding a large portion of the business, so just be aware that this can introduce some elements of risk. Ideally we'd like to see this reduce as that would mean fewer obligations bearing risks.
Our Take On eGain's ROCE
To the delight of most shareholders, eGain has now broken into profitability. And with the stock having performed exceptionally well over the last five years, these patterns are being accounted for by investors. With that being said, we still think the promising fundamentals mean the company deserves some further due diligence.
On the other side of ROCE, we have to consider valuation. That's why we have a FREE intrinsic value estimation on our platform that is definitely worth checking out.
If you want to search for solid companies with great earnings, check out this free list of companies with good balance sheets and impressive returns on equity.
This article by Simply Wall St is general in nature. We provide commentary based on historical data and analyst forecasts only using an unbiased methodology and our articles are not intended to be financial advice. It does not constitute a recommendation to buy or sell any stock, and does not take account of your objectives, or your financial situation. We aim to bring you long-term focused analysis driven by fundamental data. Note that our analysis may not factor in the latest price-sensitive company announcements or qualitative material. Simply Wall St has no position in any stocks mentioned.
Have feedback on this article? Concerned about the content? Get in touch with us directly. Alternatively, email editorial-team (at) simplywallst.com.
