
 Yahoo Finance
 Ecolab's (NYSE:ECL) Returns Have Hit A Wall
What trends should we look for it we want to identify stocks that can multiply in value over the long term? Firstly, we'd want to identify a growing return on capital employed (ROCE) and then alongside that, an ever-increasing base of capital employed. This shows us that it's a compounding machine, able to continually reinvest its earnings back into the business and generate higher returns. However, after briefly looking over the numbers, we don't think Ecolab (NYSE:ECL) has the makings of a multi-bagger going forward, but let's have a look at why that may be.
What is Return On Capital Employed (ROCE)?
For those who don't know, ROCE is a measure of a company's yearly pre-tax profit (its return), relative to the capital employed in the business. To calculate this metric for Ecolab, this is the formula:
Return on Capital Employed = Earnings Before Interest and Tax (EBIT) ÷ (Total Assets - Current Liabilities)
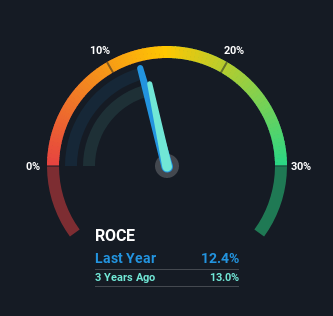
0.12 = US$1.9b ÷ (US$18b - US$2.9b) (Based on the trailing twelve months to September 2021).
So, Ecolab has an ROCE of 12%. That's a relatively normal return on capital, and it's around the 11% generated by the Chemicals industry.
See our latest analysis for Ecolab
Above you can see how the current ROCE for Ecolab compares to its prior returns on capital, but there's only so much you can tell from the past. If you'd like, you can check out the forecasts from the analysts covering Ecolab here for free.
What Does the ROCE Trend For Ecolab Tell Us?
There hasn't been much to report for Ecolab's returns and its level of capital employed because both metrics have been steady for the past five years. It's not uncommon to see this when looking at a mature and stable business that isn't re-investing its earnings because it has likely passed that phase of the business cycle. So unless we see a substantial change at Ecolab in terms of ROCE and additional investments being made, we wouldn't hold our breath on it being a multi-bagger. This probably explains why Ecolab is paying out 31% of its income to shareholders in the form of dividends. Unless businesses have highly compelling growth opportunities, they'll typically return some money to shareholders.
Our Take On Ecolab's ROCE
In summary, Ecolab isn't compounding its earnings but is generating stable returns on the same amount of capital employed. Investors must think there's better things to come because the stock has knocked it out of the park, delivering a 108% gain to shareholders who have held over the last five years. However, unless these underlying trends turn more positive, we wouldn't get our hopes up too high.
On a final note, we've found 2 warning signs for Ecolab that we think you should be aware of.
For those who like to invest in solid companies, check out this free list of companies with solid balance sheets and high returns on equity.
Have feedback on this article? Concerned about the content? Get in touch with us directly. Alternatively, email editorial-team (at) simplywallst.com.
This article by Simply Wall St is general in nature. We provide commentary based on historical data and analyst forecasts only using an unbiased methodology and our articles are not intended to be financial advice. It does not constitute a recommendation to buy or sell any stock, and does not take account of your objectives, or your financial situation. We aim to bring you long-term focused analysis driven by fundamental data. Note that our analysis may not factor in the latest price-sensitive company announcements or qualitative material. Simply Wall St has no position in any stocks mentioned.
