
 Yahoo Finance
 EBOS Group Limited's (NZSE:EBO) Stock Has Shown Weakness Lately But Financial Prospects Look Decent: Is The Market Wrong?
It is hard to get excited after looking at EBOS Group's (NZSE:EBO) recent performance, when its stock has declined 11% over the past three months. But if you pay close attention, you might find that its key financial indicators look quite decent, which could mean that the stock could potentially rise in the long-term given how markets usually reward more resilient long-term fundamentals. In this article, we decided to focus on EBOS Group's ROE.
Return on equity or ROE is a key measure used to assess how efficiently a company's management is utilizing the company's capital. In short, ROE shows the profit each dollar generates with respect to its shareholder investments.
Check out our latest analysis for EBOS Group
How Do You Calculate Return On Equity?
ROE can be calculated by using the formula:
Return on Equity = Net Profit (from continuing operations) ÷ Shareholders' Equity
So, based on the above formula, the ROE for EBOS Group is:
9.3% = AU$193m ÷ AU$2.1b (Based on the trailing twelve months to December 2021).
The 'return' is the yearly profit. That means that for every NZ$1 worth of shareholders' equity, the company generated NZ$0.09 in profit.
What Has ROE Got To Do With Earnings Growth?
We have already established that ROE serves as an efficient profit-generating gauge for a company's future earnings. We now need to evaluate how much profit the company reinvests or "retains" for future growth which then gives us an idea about the growth potential of the company. Assuming everything else remains unchanged, the higher the ROE and profit retention, the higher the growth rate of a company compared to companies that don't necessarily bear these characteristics.
EBOS Group's Earnings Growth And 9.3% ROE
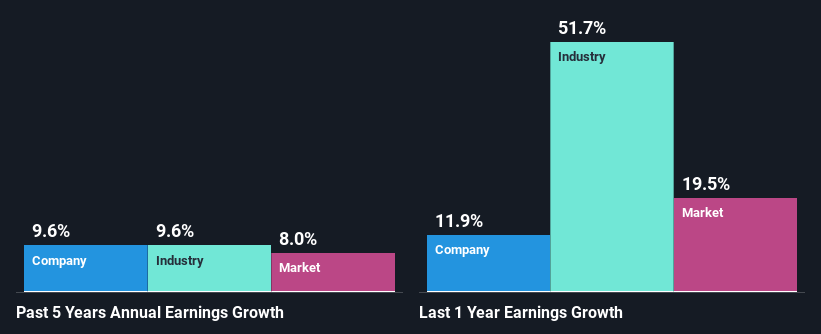
When you first look at it, EBOS Group's ROE doesn't look that attractive. Next, when compared to the average industry ROE of 15%, the company's ROE leaves us feeling even less enthusiastic. Although, we can see that EBOS Group saw a modest net income growth of 9.6% over the past five years. So, there might be other aspects that are positively influencing the company's earnings growth. Such as - high earnings retention or an efficient management in place.
As a next step, we compared EBOS Group's net income growth with the industry and found that the company has a similar growth figure when compared with the industry average growth rate of 9.6% in the same period.
The basis for attaching value to a company is, to a great extent, tied to its earnings growth. It’s important for an investor to know whether the market has priced in the company's expected earnings growth (or decline). This then helps them determine if the stock is placed for a bright or bleak future. Has the market priced in the future outlook for EBO? You can find out in our latest intrinsic value infographic research report.
Is EBOS Group Using Its Retained Earnings Effectively?
The high three-year median payout ratio of 74% (or a retention ratio of 26%) for EBOS Group suggests that the company's growth wasn't really hampered despite it returning most of its income to its shareholders.
Additionally, EBOS Group has paid dividends over a period of at least ten years which means that the company is pretty serious about sharing its profits with shareholders. Our latest analyst data shows that the future payout ratio of the company over the next three years is expected to be approximately 70%. However, EBOS Group's ROE is predicted to rise to 13% despite there being no anticipated change in its payout ratio.
Conclusion
In total, it does look like EBOS Group has some positive aspects to its business. That is, quite an impressive growth in earnings. However, the low profit retention means that the company's earnings growth could have been higher, had it been reinvesting a higher portion of its profits. With that said, the latest industry analyst forecasts reveal that the company's earnings are expected to accelerate. Are these analysts expectations based on the broad expectations for the industry, or on the company's fundamentals? Click here to be taken to our analyst's forecasts page for the company.
Have feedback on this article? Concerned about the content? Get in touch with us directly. Alternatively, email editorial-team (at) simplywallst.com.
This article by Simply Wall St is general in nature. We provide commentary based on historical data and analyst forecasts only using an unbiased methodology and our articles are not intended to be financial advice. It does not constitute a recommendation to buy or sell any stock, and does not take account of your objectives, or your financial situation. We aim to bring you long-term focused analysis driven by fundamental data. Note that our analysis may not factor in the latest price-sensitive company announcements or qualitative material. Simply Wall St has no position in any stocks mentioned.
Join A Paid User Research Session
You’ll receive a US$30 Amazon Gift card for 1 hour of your time while helping us build better investing tools for the individual investors like yourself. Sign up here
