
 Yahoo Finance
 Earnings growth of 23% over 3 years hasn't been enough to translate into positive returns for CONMED (NYSE:CNMD) shareholders
As an investor its worth striving to ensure your overall portfolio beats the market average. But if you try your hand at stock picking, your risk returning less than the market. We regret to report that long term CONMED Corporation (NYSE:CNMD) shareholders have had that experience, with the share price dropping 39% in three years, versus a market return of about 22%. Furthermore, it's down 31% in about a quarter. That's not much fun for holders. This could be related to the recent financial results - you can catch up on the most recent data by reading our company report.
With the stock having lost 10.0% in the past week, it's worth taking a look at business performance and seeing if there's any red flags.
View our latest analysis for CONMED
To paraphrase Benjamin Graham: Over the short term the market is a voting machine, but over the long term it's a weighing machine. By comparing earnings per share (EPS) and share price changes over time, we can get a feel for how investor attitudes to a company have morphed over time.
CONMED became profitable within the last five years. We would usually expect to see the share price rise as a result. So it's worth looking at other metrics to try to understand the share price move.
The modest 1.0% dividend yield is unlikely to be guiding the market view of the stock. Revenue is actually up 10% over the three years, so the share price drop doesn't seem to hinge on revenue, either. It's probably worth investigating CONMED further; while we may be missing something on this analysis, there might also be an opportunity.
The graphic below depicts how earnings and revenue have changed over time (unveil the exact values by clicking on the image).
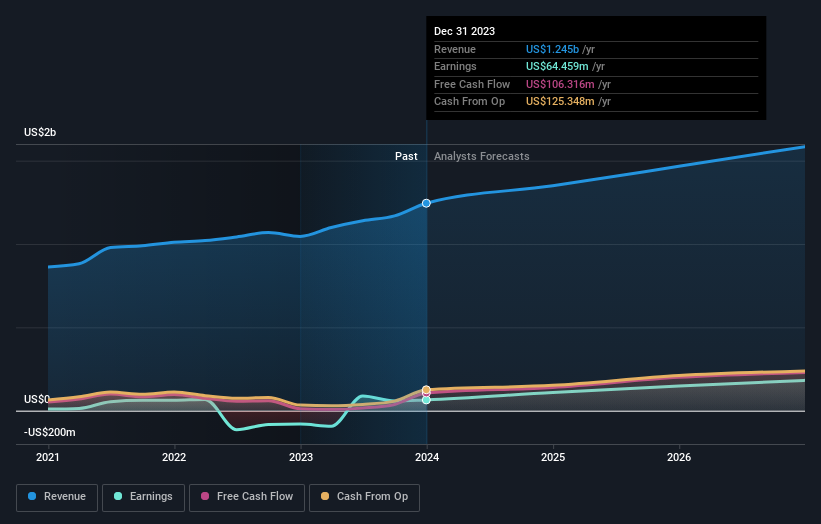
It is of course excellent to see how CONMED has grown profits over the years, but the future is more important for shareholders. If you are thinking of buying or selling CONMED stock, you should check out this FREE detailed report on its balance sheet.
A Different Perspective
While the broader market gained around 31% in the last year, CONMED shareholders lost 17% (even including dividends). However, keep in mind that even the best stocks will sometimes underperform the market over a twelve month period. Unfortunately, last year's performance may indicate unresolved challenges, given that it was worse than the annualised loss of 0.3% over the last half decade. Generally speaking long term share price weakness can be a bad sign, though contrarian investors might want to research the stock in hope of a turnaround. I find it very interesting to look at share price over the long term as a proxy for business performance. But to truly gain insight, we need to consider other information, too. Case in point: We've spotted 1 warning sign for CONMED you should be aware of.
But note: CONMED may not be the best stock to buy. So take a peek at this free list of interesting companies with past earnings growth (and further growth forecast).
Please note, the market returns quoted in this article reflect the market weighted average returns of stocks that currently trade on American exchanges.
Have feedback on this article? Concerned about the content? Get in touch with us directly. Alternatively, email editorial-team (at) simplywallst.com.
This article by Simply Wall St is general in nature. We provide commentary based on historical data and analyst forecasts only using an unbiased methodology and our articles are not intended to be financial advice. It does not constitute a recommendation to buy or sell any stock, and does not take account of your objectives, or your financial situation. We aim to bring you long-term focused analysis driven by fundamental data. Note that our analysis may not factor in the latest price-sensitive company announcements or qualitative material. Simply Wall St has no position in any stocks mentioned.
