
 Yahoo Finance
 E&P Financial Group (ASX:EP1) shareholders have endured a 74% loss from investing in the stock five years ago
We're definitely into long term investing, but some companies are simply bad investments over any time frame. We really hate to see fellow investors lose their hard-earned money. Spare a thought for those who held E&P Financial Group Limited (ASX:EP1) for five whole years - as the share price tanked 79%. We also note that the stock has performed poorly over the last year, with the share price down 26%.
Since shareholders are down over the longer term, lets look at the underlying fundamentals over the that time and see if they've been consistent with returns.
View our latest analysis for E&P Financial Group
In his essay The Superinvestors of Graham-and-Doddsville Warren Buffett described how share prices do not always rationally reflect the value of a business. One imperfect but simple way to consider how the market perception of a company has shifted is to compare the change in the earnings per share (EPS) with the share price movement.
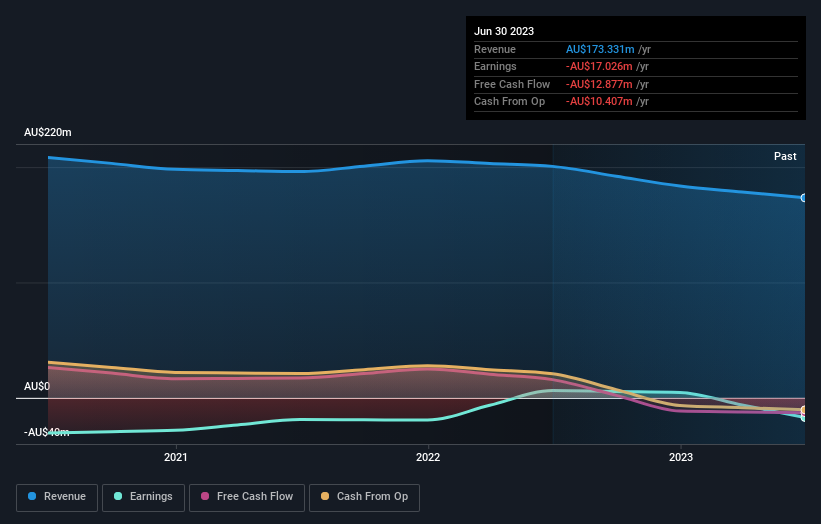
E&P Financial Group became profitable within the last five years. On the other hand, it reported a trailing twelve months loss, suggesting it isn't reliably profitable. Other metrics might give us a better handle on how its value is changing over time.
Arguably, the revenue drop of 9.9% a year for half a decade suggests that the company can't grow in the long term. This has probably encouraged some shareholders to sell down the stock.
The graphic below depicts how earnings and revenue have changed over time (unveil the exact values by clicking on the image).
You can see how its balance sheet has strengthened (or weakened) over time in this free interactive graphic.
What About The Total Shareholder Return (TSR)?
We'd be remiss not to mention the difference between E&P Financial Group's total shareholder return (TSR) and its share price return. Arguably the TSR is a more complete return calculation because it accounts for the value of dividends (as if they were reinvested), along with the hypothetical value of any discounted capital that have been offered to shareholders. Dividends have been really beneficial for E&P Financial Group shareholders, and that cash payout explains why its total shareholder loss of 74%, over the last 5 years, isn't as bad as the share price return.
A Different Perspective
While the broader market gained around 6.3% in the last year, E&P Financial Group shareholders lost 23%. Even the share prices of good stocks drop sometimes, but we want to see improvements in the fundamental metrics of a business, before getting too interested. Unfortunately, longer term shareholders are suffering worse, given the loss of 12% doled out over the last five years. We'd need to see some sustained improvements in the key metrics before we could muster much enthusiasm. While it is well worth considering the different impacts that market conditions can have on the share price, there are other factors that are even more important. Even so, be aware that E&P Financial Group is showing 2 warning signs in our investment analysis , and 1 of those shouldn't be ignored...
Of course E&P Financial Group may not be the best stock to buy. So you may wish to see this free collection of growth stocks.
Please note, the market returns quoted in this article reflect the market weighted average returns of stocks that currently trade on Australian exchanges.
Have feedback on this article? Concerned about the content? Get in touch with us directly. Alternatively, email editorial-team (at) simplywallst.com.
This article by Simply Wall St is general in nature. We provide commentary based on historical data and analyst forecasts only using an unbiased methodology and our articles are not intended to be financial advice. It does not constitute a recommendation to buy or sell any stock, and does not take account of your objectives, or your financial situation. We aim to bring you long-term focused analysis driven by fundamental data. Note that our analysis may not factor in the latest price-sensitive company announcements or qualitative material. Simply Wall St has no position in any stocks mentioned.
