
 Yahoo Finance
 E-mini NASDAQ-100 Index (NQ) Futures Technical Analysis – Minor Trend Turns Up, Momentum Building
March E-mini NASDAQ-100 Index futures are trading higher shortly before the close. The index is the strongest of the three majors. Despite the strength, volume is average to below average. The index is currently in a position to finish higher for the week.
Daily Technical Analysis
The main trend is down according to the daily swing chart, however, the minor trend is up and momentum is trending higher.
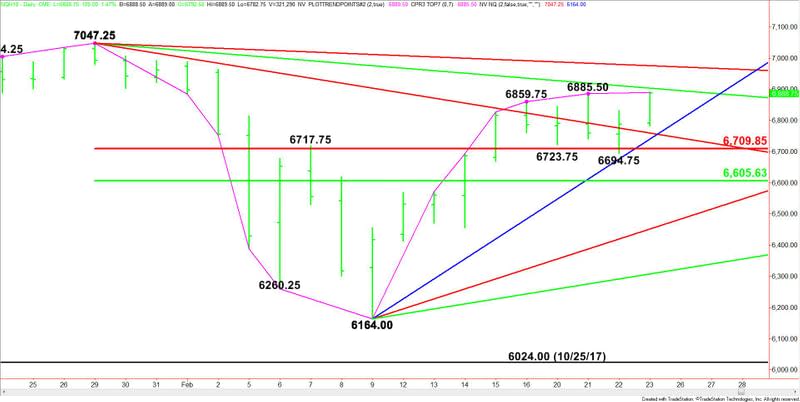
The trade through 6885.50 today indicates the buying is getting stronger. This move also negated Wednesday’s closing price reversal top. If the upside momentum continues then 7047.25 will become the primary upside target.
The new minor bottom is 6694.75. A trade through this level will change the minor trend to down.
The main range is 7047.25 to 6164.00. Its retracement zone is 6709.75 to 6605.50. Holding above this zone is giving the index an upside bias.
Daily Technical Forecast
Based on the price action into the close, traders appear to be going after the downtrending Gann angle at 6903.25. We could see a technical bounce on the first test of this angle, but taking it out could trigger an acceleration to the upside with the next target angle coming in at 6975.25. This is the last potential resistance angle before the 7047.25 main top.
The inability to overcome 6903.25 could trigger some light selling into the close. The key support is a pair of Gann angles at 6759.25 and 6740.00. This is followed by the main Fibonacci level at 6709.75.
This article was originally posted on FX Empire
