
 Yahoo Finance
 E-mini NASDAQ-100 Index (NQ) Futures Technical Analysis – December 14, 2017 Forecast
March E-mini NASDAQ-100 Index futures are trading higher shortly after the opening. There was no follow-through to the upside after yesterday’s rally. The inside move suggests investor indecision and impending volatility. With the Fed rate hike out of the way, this may mean investors are waiting for fresh news about tax reform. Positive news should trigger an acceleration to the upside.
Daily Technical Analysis
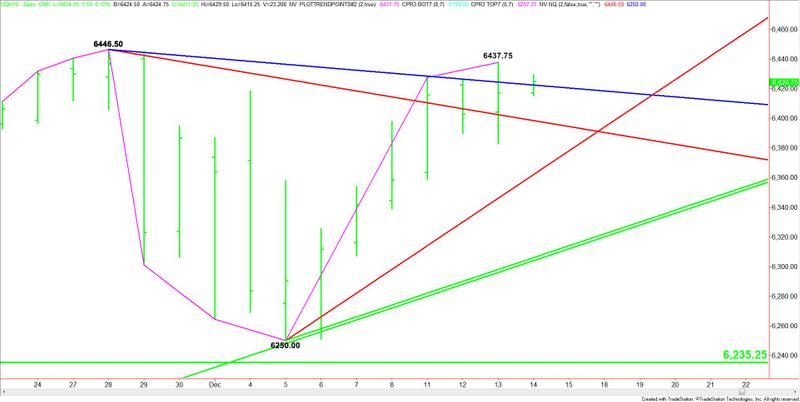
The main trend is up according to the daily swing chart. A trade through 6437.75 will indicate the buying is getting stronger. A move through 6446.50 will signal a resumption of the uptrend.
Taking out 6437.75 then trading under yesterday’s close at 6417.25 will be the first sign of weakness. A close under this price will produce a closing price reversal top. This could lead to the start of a 2 to 3 day correction.
Daily Technical Forecast
Based on the early trade, the direction of the NASDAQ-100 Index the rest of the session is likely to be determined by trader reaction to the downtrending Gann angle at 6422.50.
Overtaking 6422.50 and sustaining the move will indicate the presence of buyers. This could generate the upside momentum needed to trigger a test of 6437.75 then 6446.50.
A sustained move under 6422.50 will signal the presence of sellers. This could create the downside momentum need to challenge the next downtrending Gann angle at 6398.50.
Taking out the angle at 6398.50 will indicate the selling is getting stronger. This could fuel an acceleration to the downside with the major uptrending angle at 6362.00 the next target.
Basically, treat 6422.50 like a pivot today.
This article was originally posted on FX Empire
