
 Yahoo Finance
 E-mini NASDAQ-100 Index (NQ) Futures Technical Analysis – November 8, 2018 Forecast
December E-mini NASDAQ-100 Index futures are trading lower shortly before the cash market opening. Earlier in the session, buyers attempted to follow-through to the upside following yesterday’s strong rally, but the move stalled as investors expressed caution ahead of today’s release of the Fed’s latest interest decision and monetary policy statement.
Yesterday’s strong rally was fueled by relief over the outcome of the mid-term elections and optimism that the Democrats and Republicans would set aside politics in an effort to keep the economy growing.
Daily Swing Chart Technical Analysis
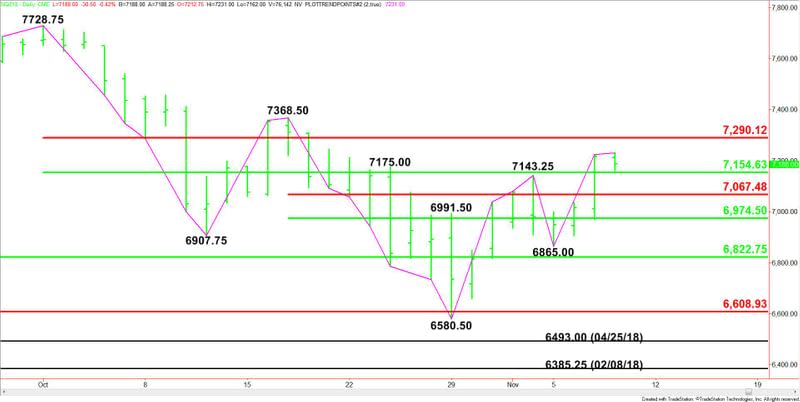
The main trend is up according to the daily swing chart. The trend turned up on a trade through 7143.25. The next upside target is the main top at 7368.50. The main trend will change to down on a trade through 6865.00.
Today is also the eighth day up from the 6850.50 bottom on October 29. This puts the index inside the window of time for a potentially bearish closing price reversal top. We’ve already had the higher-high, now all we need is the lower close to form this chart pattern.
The price action today will be influenced by a series of retracement levels. They suggest that the way of least resistance is to the upside. Any selling is likely to be labored.
Daily Swing Chart Technical Forecast
Based on the early price action, the direction of the December E-mini NASDAQ-100 Index futures contract is likely to be determined by the main 50% level at 7154.50.
A sustained move over 7154.50 will indicate the presence of buyers. If this generates enough upside momentum then look for buyers to take a run at the main Fibonacci level at 7290.25. This is a potential trigger point for a surge into the main top at 7368.50. Taking out this level will reaffirm the uptrend.
A sustained move under 7154.50 will signal the presence of sellers. The first downside target is a short-term Fibonacci level at 7067.50, followed by a short-term 50% level at 6974.50.
More aggressive traders can use yesterday’s close at 7218.50 as the key price to watch today. Holding above it will indicate the buying is getting stronger. A break below it will put the index in a position to form a potentially bearish closing price reversal top.
This article was originally posted on FX Empire