
 Yahoo Finance
 E-mini NASDAQ-100 Index (NQ) Futures Technical Analysis – March 19, 2018 Forecast
June E-mini NASDAQ-100 Index futures are trading sharply lower early Monday. Traders are positioning themselves ahead of Wednesday’s Fed meeting. Additionally, there are concerns over possible trade wars, and turmoil in the Whitehouse. NASDAQ investors are also concerned that possible tariffs against China could target technology.
Daily Swing Chart Technical Analysis
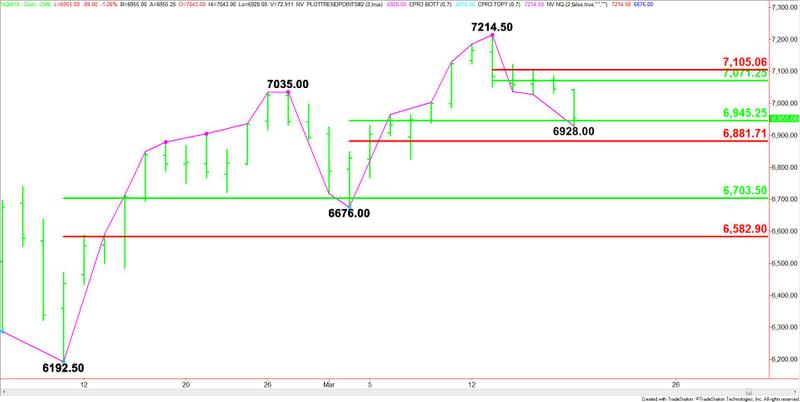
The main trend is up according to the daily swing chart. However, momentum has been trending lower since the formation of the closing price reversal top at 7214.50.
The main range is 6192.50 to 7214.50. Its retracement zone at 6703.50 to 6583.00 is the primary downside target.
The intermediate range is 6676.00 to 7214.50. Its retracement zone at 6945.25 to 6881.75 is currently being tested. Since the main trend is up, buyers are coming in to support the market.
The new short-term range is 7214.50 to 6928.00. If today’s intraday low at 6928.00 holds as support then we could see a rebound rally into its retracement zone at 7071.25 to 7105.00.
Daily Swing Chart Technical Forecast
Based on the early trade, the direction of the index the rest of the session is likely to be determined by trader reaction to the 50% level at 6945.25.
A sustained move over 6945.25 will indicate the presence of buyers. This move could generate the upside momentum needed to challenge 7071.25.
A sustained move under 6945.25 will signal the presence of sellers. This could lead to a quick test of 6928.00, followed by 6881.75.
The Fib level at 6881.75 is the trigger point for an acceleration to the downside with potential targets at 6703.50 and 6676.00.
This article was originally posted on FX Empire
