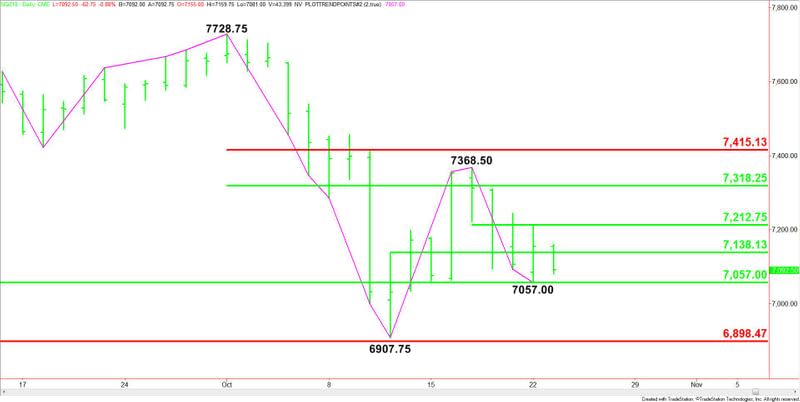
E-mini NASDAQ-100 Index (NQ) Futures Technical Analysis – In Position to Challenge Major RT Zone at 7057.00 to 6898.50
December E-mini NASDAQ-100 Index futures are trading lower early Tuesday after failing to follow-through to the upside following yesterday’s closing price reversal bottom. This may be an indication that the chart pattern was formed by short-covering rather than aggressive counter-trend buying. Buyers are trying to form a secondary higher bottom.
At 0407 GMT, December E-mini NASDAQ-100 Index futures are trading 7092.25, down 63.00 or -0.89%.

Daily Swing Chart Technical Analysis
The main trend is down according to the daily swing chart. A trade through 7368.50 will change the main trend to up. A move through 6907.75 will signal a resumption of the downtrend.
The major support zone is 7057.00 to 6898.50. This zone helped form the main bottom at 6907.75.
The main range is 7728.75 to 6907.75. Its retracement zone is 7318.25 to 7415.25. This zone stopped the rally at 7368.50 last week.
There are two short-term ranges, 6907.75 to 7368.50 and 7368.50 to 7057.00. There 50% levels or pivots are 7138.25 and 7212.75 respectively. With the main trend down, these two levels are acting like resistance.
Daily Swing Chart Technical Forecast
Based on Monday’s close at 7155.25 and the early price action, the direction of the December E-mini NASDAQ-100 Index futures contract on Tuesday is likely to be determined by trader reaction to the short-term pivot at 7138.25.
A sustained move under 7138.25 will indicate the presence of sellers. This could lead to a quick test of the major 50% level and yesterday’s low at 7057.00.
Taking out 7057.00 could trigger an acceleration to the downside with the next major targets the main bottom at 6907.75 and the major Fibonacci level at 6898.50.
A sustained move over 7138.25 will signal the presence of buyers. If this creates enough upside momentum then look for a challenge of the next pivot at 7212.75. This is a potential trigger point for an acceleration into the main 50% level at 7318.25, followed by the main top at 7368.50 and the main Fibonacci level at 7415.25.
This article was originally posted on FX Empire

 Yahoo Finance