
 Yahoo Finance
 Is Duxton Water Limited's (ASX:D2O) Balance Sheet Strong Enough To Weather A Storm?

Want to participate in a research study? Help shape the future of investing tools and earn a $60 gift card!
Duxton Water Limited (ASX:D2O) is a small-cap stock with a market capitalization of AU$179m. While investors primarily focus on the growth potential and competitive landscape of the small-cap companies, they end up ignoring a key aspect, which could be the biggest threat to its existence: its financial health. Why is it important? Understanding the company's financial health becomes crucial, as mismanagement of capital can lead to bankruptcies, which occur at a higher rate for small-caps. Let's work through some financial health checks you may wish to consider if you're interested in this stock. Nevertheless, this is not a comprehensive overview, so I recommend you dig deeper yourself into D2O here.
D2O’s Debt (And Cash Flows)
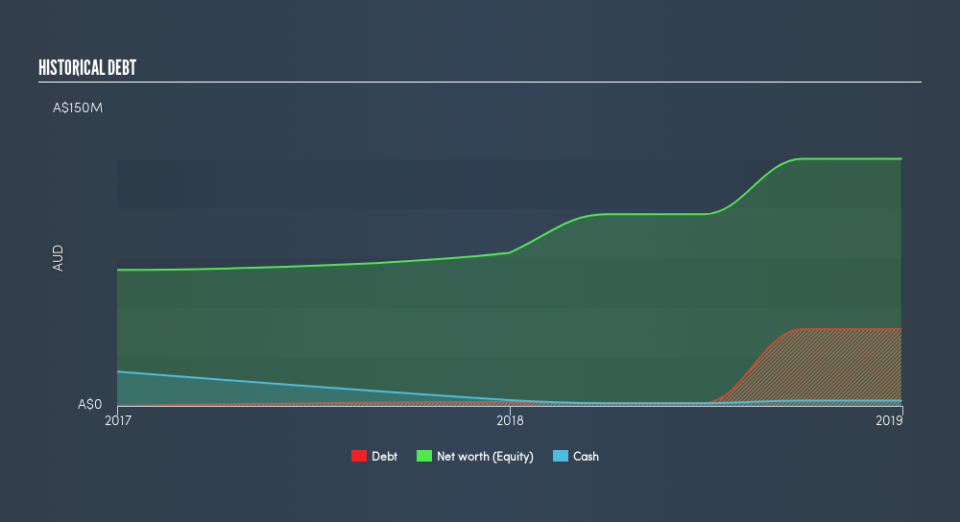
Over the past year, D2O has ramped up its debt from AU$2.0m to AU$39m , which includes long-term debt. With this increase in debt, D2O currently has AU$2.7m remaining in cash and short-term investments to keep the business going. Moving on, operating cash flow was negative over the last twelve months. As the purpose of this article is a high-level overview, I won’t be looking at this today, but you can take a look at some of D2O’s operating efficiency ratios such as ROA here.
Does D2O’s liquid assets cover its short-term commitments?
With current liabilities at AU$5.0m, it seems that the business has been able to meet these obligations given the level of current assets of AU$29m, with a current ratio of 5.68x. The current ratio is calculated by dividing current assets by current liabilities. However, a ratio greater than 3x may be considered by some to be quite high, however this is not necessarily a negative for the company.
Does D2O face the risk of succumbing to its debt-load?
With debt at 31% of equity, D2O may be thought of as appropriately levered. This range is considered safe as D2O is not taking on too much debt obligation, which can be restrictive and risky for equity-holders. We can test if D2O’s debt levels are sustainable by measuring interest payments against earnings of a company. Ideally, earnings before interest and tax (EBIT) should cover net interest by at least three times. For D2O, the ratio of 18.43x suggests that interest is comfortably covered, which means that lenders may be inclined to lend more money to the company, as it is seen as safe in terms of payback.
Next Steps:
D2O’s debt level is appropriate for a company its size, and it is also able to generate sufficient cash flow coverage, meaning it has been able to put its debt in good use. Furthermore, the company will be able to pay all of its upcoming liabilities from its current short-term assets. Keep in mind I haven't considered other factors such as how D2O has been performing in the past. You should continue to research Duxton Water to get a more holistic view of the stock by looking at:
Historical Performance: What has D2O's returns been like over the past? Go into more detail in the past track record analysis and take a look at the free visual representations of our analysis for more clarity.
Other High-Performing Stocks: Are there other stocks that provide better prospects with proven track records? Explore our free list of these great stocks here.
We aim to bring you long-term focused research analysis driven by fundamental data. Note that our analysis may not factor in the latest price-sensitive company announcements or qualitative material.
If you spot an error that warrants correction, please contact the editor at editorial-team@simplywallst.com. This article by Simply Wall St is general in nature. It does not constitute a recommendation to buy or sell any stock, and does not take account of your objectives, or your financial situation. Simply Wall St has no position in the stocks mentioned. Thank you for reading.
