
 Yahoo Finance
 Duxton Water (ASX:D2O) Shareholders Have Enjoyed A 24% Share Price Gain
By buying an index fund, you can roughly match the market return with ease. But many of us dare to dream of bigger returns, and build a portfolio ourselves. For example, the Duxton Water Limited (ASX:D2O) share price is up 24% in the last three years, clearly besting the market return of around 17% (not including dividends). However, more recent returns haven't been as impressive as that, with the stock returning just 12% in the last year , including dividends .
See our latest analysis for Duxton Water
While markets are a powerful pricing mechanism, share prices reflect investor sentiment, not just underlying business performance. One way to examine how market sentiment has changed over time is to look at the interaction between a company's share price and its earnings per share (EPS).
Duxton Water was able to grow its EPS at 32% per year over three years, sending the share price higher. This EPS growth is higher than the 7% average annual increase in the share price. So one could reasonably conclude that the market has cooled on the stock.
The image below shows how EPS has tracked over time (if you click on the image you can see greater detail).
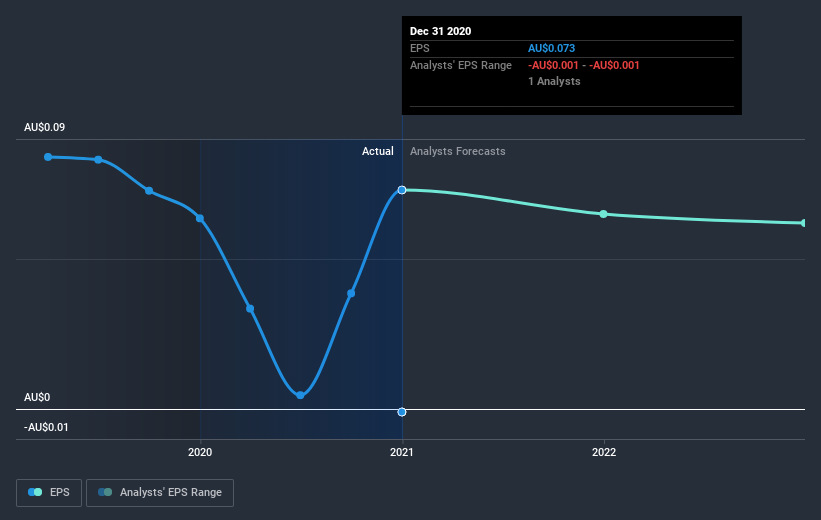
It is of course excellent to see how Duxton Water has grown profits over the years, but the future is more important for shareholders. Take a more thorough look at Duxton Water's financial health with this free report on its balance sheet.
What About Dividends?
When looking at investment returns, it is important to consider the difference between total shareholder return (TSR) and share price return. Whereas the share price return only reflects the change in the share price, the TSR includes the value of dividends (assuming they were reinvested) and the benefit of any discounted capital raising or spin-off. Arguably, the TSR gives a more comprehensive picture of the return generated by a stock. In the case of Duxton Water, it has a TSR of 38% for the last 3 years. That exceeds its share price return that we previously mentioned. The dividends paid by the company have thusly boosted the total shareholder return.
A Different Perspective
Over the last year Duxton Water shareholders have received a TSR of 12%. While you don't go broke making a profit, this return was actually lower than the average market return of about 54%. On the other hand, the TSR over three years was worse, at just 11% per year. This suggests the company's position is improving. If the share price is up as a result of improved business performance, then this kind of improvement may be sustained. It's always interesting to track share price performance over the longer term. But to understand Duxton Water better, we need to consider many other factors. Like risks, for instance. Every company has them, and we've spotted 4 warning signs for Duxton Water (of which 2 are a bit concerning!) you should know about.
Of course Duxton Water may not be the best stock to buy. So you may wish to see this free collection of growth stocks.
Please note, the market returns quoted in this article reflect the market weighted average returns of stocks that currently trade on AU exchanges.
This article by Simply Wall St is general in nature. It does not constitute a recommendation to buy or sell any stock, and does not take account of your objectives, or your financial situation. We aim to bring you long-term focused analysis driven by fundamental data. Note that our analysis may not factor in the latest price-sensitive company announcements or qualitative material. Simply Wall St has no position in any stocks mentioned.
Have feedback on this article? Concerned about the content? Get in touch with us directly. Alternatively, email editorial-team (at) simplywallst.com.
