
 Yahoo Finance
 Downer EDI (ASX:DOW) Will Be Looking To Turn Around Its Returns
What underlying fundamental trends can indicate that a company might be in decline? Typically, we'll see the trend of both return on capital employed (ROCE) declining and this usually coincides with a decreasing amount of capital employed. This reveals that the company isn't compounding shareholder wealth because returns are falling and its net asset base is shrinking. And from a first read, things don't look too good at Downer EDI (ASX:DOW), so let's see why.
Understanding Return On Capital Employed (ROCE)
For those who don't know, ROCE is a measure of a company's yearly pre-tax profit (its return), relative to the capital employed in the business. The formula for this calculation on Downer EDI is:
Return on Capital Employed = Earnings Before Interest and Tax (EBIT) ÷ (Total Assets - Current Liabilities)
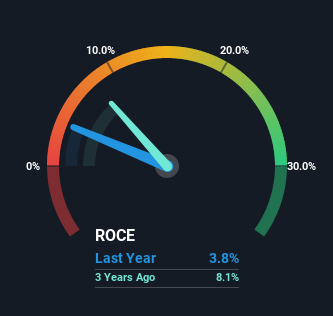
0.038 = AU$178m ÷ (AU$7.5b - AU$2.7b) (Based on the trailing twelve months to June 2022).
So, Downer EDI has an ROCE of 3.8%. In absolute terms, that's a low return and it also under-performs the Commercial Services industry average of 8.1%.
View our latest analysis for Downer EDI
Above you can see how the current ROCE for Downer EDI compares to its prior returns on capital, but there's only so much you can tell from the past. If you'd like, you can check out the forecasts from the analysts covering Downer EDI here for free.
So How Is Downer EDI's ROCE Trending?
We are a bit worried about the trend of returns on capital at Downer EDI. To be more specific, the ROCE was 5.6% five years ago, but since then it has dropped noticeably. On top of that, it's worth noting that the amount of capital employed within the business has remained relatively steady. Companies that exhibit these attributes tend to not be shrinking, but they can be mature and facing pressure on their margins from competition. If these trends continue, we wouldn't expect Downer EDI to turn into a multi-bagger.
The Key Takeaway
In the end, the trend of lower returns on the same amount of capital isn't typically an indication that we're looking at a growth stock. It should come as no surprise then that the stock has fallen 35% over the last five years, so it looks like investors are recognizing these changes. Unless there is a shift to a more positive trajectory in these metrics, we would look elsewhere.
One more thing, we've spotted 2 warning signs facing Downer EDI that you might find interesting.
While Downer EDI isn't earning the highest return, check out this free list of companies that are earning high returns on equity with solid balance sheets.
Have feedback on this article? Concerned about the content? Get in touch with us directly. Alternatively, email editorial-team (at) simplywallst.com.
This article by Simply Wall St is general in nature. We provide commentary based on historical data and analyst forecasts only using an unbiased methodology and our articles are not intended to be financial advice. It does not constitute a recommendation to buy or sell any stock, and does not take account of your objectives, or your financial situation. We aim to bring you long-term focused analysis driven by fundamental data. Note that our analysis may not factor in the latest price-sensitive company announcements or qualitative material. Simply Wall St has no position in any stocks mentioned.
Join A Paid User Research Session
You’ll receive a US$30 Amazon Gift card for 1 hour of your time while helping us build better investing tools for the individual investors like yourself. Sign up here
