Dow Jones Industrial Average Mired in a Shallow Correction
DailyFX.com -
Talking Points
-Dow Jones Industrial Average (DJIA) continues to consolidate near all-time highs
-A technical correction to 18,167 area cannot be ruled out and would be normal within the context of this up trend
-Anticipating an eventual break higher towards 19,700
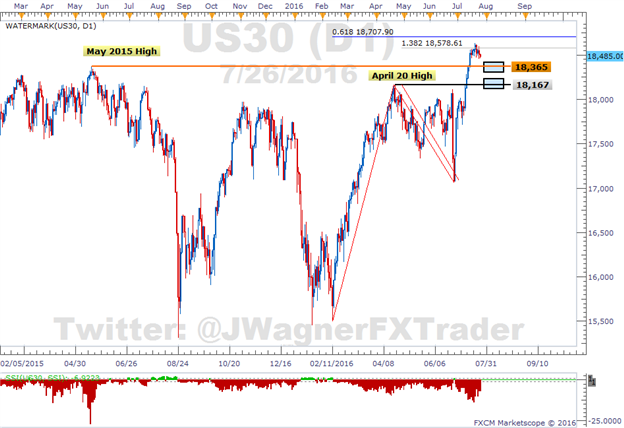
Dow Jones Industrial Average continues consolidating its recent all-time highs. This consolidation appears to be a technical correction that is anticipated to be shallow.
Though another 2 point correction cannot be ruled out, a sell off that of that nature simply drives prices back to previous resistance levels. Those traders familiar with technical analysis know that old resistance, when broken, becomes new support. Therefore, it would be quite normal to see US30, a CFD which tracks the DJIA, move lower to 18,365 (May 19, 2015 high) or 18,167 (April 20 high). These levels may then support a bounce and continuation of the bull trend.
Chart created using FXCM’s Trading Station
Medium term, the technical picture is still bullish for US30. We are anticipating an eventual break of last week’s high for a move towards 19,700. If prices start digging below 17,800, then we’ll need to consider the higher probability pattern.
Day traders for DJIA can follow the Grid Sight Index (GSI) for intraday momentum swings. GSI is a big data indicator which analyzes millions of price points and thousands of trend components in real time to determine how many historical patterns match up to the current price action. The results show how previous patterns have behaved, though past performance is not indicative of future results.
Check out US30 on ‘m3’ or ‘m5’ via GSI here.
Good luck!
Suggested Reading:All Time Highs are Hard Work
Dow Jones Industrial Average Punches Back After Brexit Collapse
Interested in a longer term outlook for equities? Download our quarterly forecast here.
Do your losing trades overshadow your winning trades? Learn about the psychology behind why that might be happening in our Traits of Successful Traders research.
---Written by Jeremy Wagner, Head Trading Instructor, DailyFX EDU
Follow me on Twitter at @JWagnerFXTrader .
See Jeremy’s recent articles at his Bio Page.
To receive additional articles from Jeremy via email, join Jeremy’s distribution list.
Check out the latest standings for the FXCM trading contest HERE.
DailyFX provides forex news and technical analysis on the trends that influence the global currency markets.
Learn forex trading with a free practice account and trading charts from FXCM.

 Yahoo Finance

