
 Yahoo Finance
 Don’t Sell doBank S.p.A. (BIT:DOB) Before You Read This

This article is written for those who want to get better at using price to earnings ratios (P/E ratios). To keep it practical, we’ll show how doBank S.p.A.’s (BIT:DOB) P/E ratio could help you assess the value on offer. Based on the last twelve months, doBank’s P/E ratio is 19.57. In other words, at today’s prices, investors are paying €19.57 for every €1 in prior year profit.
View our latest analysis for doBank
How Do You Calculate A P/E Ratio?
The formula for price to earnings is:
Price to Earnings Ratio = Share Price ÷ Earnings per Share (EPS)
Or for doBank:
P/E of 19.57 = €13.11 ÷ €0.67 (Based on the year to December 2018.)
Is A High Price-to-Earnings Ratio Good?
A higher P/E ratio implies that investors pay a higher price for the earning power of the business. That is not a good or a bad thing per se, but a high P/E does imply buyers are optimistic about the future.
How Growth Rates Impact P/E Ratios
P/E ratios primarily reflect market expectations around earnings growth rates. When earnings grow, the ‘E’ increases, over time. That means even if the current P/E is high, it will reduce over time if the share price stays flat. So while a stock may look expensive based on past earnings, it could be cheap based on future earnings.
Most would be impressed by doBank earnings growth of 15% in the last year. And its annual EPS growth rate over 5 years is 89%. With that performance, you might expect an above average P/E ratio.
How Does doBank’s P/E Ratio Compare To Its Peers?
The P/E ratio indicates whether the market has higher or lower expectations of a company. As you can see below, doBank has a higher P/E than the average company (14.3) in the diversified financial industry.
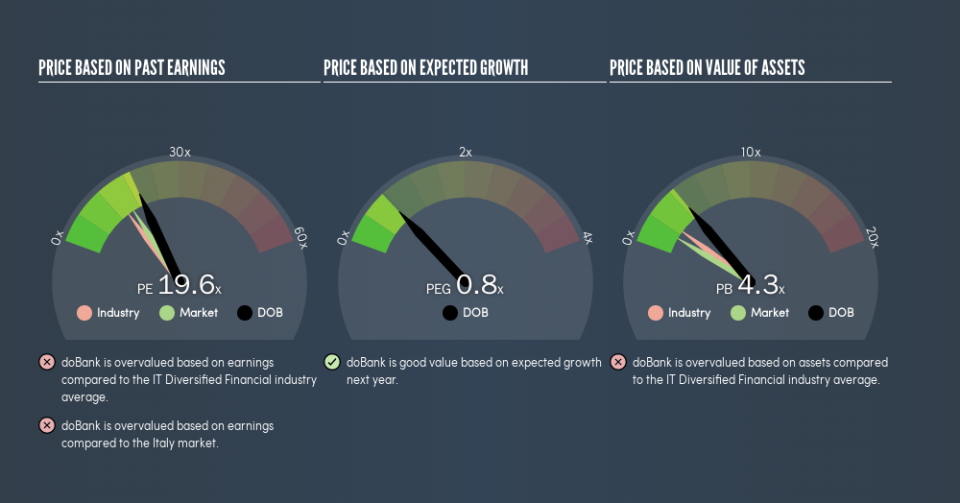
That means that the market expects doBank will outperform other companies in its industry. Clearly the market expects growth, but it isn’t guaranteed. So investors should delve deeper. I like to check if company insiders have been buying or selling.
A Limitation: P/E Ratios Ignore Debt and Cash In The Bank
Don’t forget that the P/E ratio considers market capitalization. Thus, the metric does not reflect cash or debt held by the company. Hypothetically, a company could reduce its future P/E ratio by spending its cash (or taking on debt) to achieve higher earnings.
Such expenditure might be good or bad, in the long term, but the point here is that the balance sheet is not reflected by this ratio.
doBank’s Balance Sheet
Since doBank holds net cash of €68m, it can spend on growth, justifying a higher P/E ratio than otherwise.
The Bottom Line On doBank’s P/E Ratio
doBank trades on a P/E ratio of 19.6, which is above the IT market average of 16. Its net cash position supports a higher P/E ratio, as does its solid recent earnings growth. So it does not seem strange that the P/E is above average.
Investors have an opportunity when market expectations about a stock are wrong. As value investor Benjamin Graham famously said, ‘In the short run, the market is a voting machine but in the long run, it is a weighing machine.’ So this free visualization of the analyst consensus on future earnings could help you make the right decision about whether to buy, sell, or hold.
Of course you might be able to find a better stock than doBank. So you may wish to see this free collection of other companies that have grown earnings strongly.
We aim to bring you long-term focused research analysis driven by fundamental data. Note that our analysis may not factor in the latest price-sensitive company announcements or qualitative material.
If you spot an error that warrants correction, please contact the editor at editorial-team@simplywallst.com. This article by Simply Wall St is general in nature. It does not constitute a recommendation to buy or sell any stock, and does not take account of your objectives, or your financial situation. Simply Wall St has no position in the stocks mentioned. Thank you for reading.
