
 Yahoo Finance
 Dollar Technical Analysis: USD Breaks From Larger Bullish Channel
DailyFX.com -
Talking Points:
-Dollar Technical Strategy: breaking below on LT trend support, breakdown < 99 opens up downside
-Previous Post: Dollar Technical Analysis: Recent Hikes Have Led To Peaks in DXY
-Mass exodus of institutional USD Bulls in Eurodollars likely to worry DXY Bulls
-If you’re looking for trading ideas, check out our Trading Guides
What if we get a flip of the recent narrative in global bonds? That could be developing if you watch the spread between government bonds with the US on the possible losing side if the observed trend continues. The observed trend has been that the Trump-induced reflation has been outsourced from the US, which has caused a tightening of the premium of US yields to other governments.
As an FX trader who has to keep an eye on fundamentals and themes, bond yields are important to watch. What is worth watching is a possible peaking of the yields (possible bottoming in the price of rates), which would allow other sovereign yields to come closer in line with US Yields. A narrowing of the yield spread could allow a macro mean reversion to develop that would likely mean a stronger EUR, JPY, and GBP as USD comes to a historical norm.
A Breakout Higher In TLT (Long Bond Price) Would Favor Relative USD Weakness

Chart Created by Tyler Yell, CMT
I recently discussed the record Eurodollar short position coming out of the market that would likely cause a ripple effect that leads to a softer USD. Another positioning development worth watching is the positioning unwind of bonds. At the beginning of the month, the speculative short positioning in Bonds (TNX) was at record levels as speculators were confident yields would skyrocket and the price would drop. This confidence is based on inflation overshooting, but the failure for inflation (which is tied to the price of Crude Oil) to outstrip forecasts could leave the record level of speculators on the wrong side of the trade.
After the “Dovish Hike” from the Fed on March 14, we’ve seen a move lower in yields and higher in price that aligns with what we see on the long bond price chart above. The narrative behind the dovish hike was against the reason speculators per the CFTC CoT held a record short position, which was that we’d see inflation pressures pushing the Fed to act. The chart above is of the Long Bond price that could show a completed move lower that is now set to reverse higher, which would narrow the gap between sovereign bonds.
The technical validation level of a stronger move higher that could likely weaken USD given the current correlation would take place on a price closing above 122.14, the late November high.
As noted earlier, a narrowing of the gap
Technical View: The level worth keeping tabs on in the DXY looks to be 99.23, which is the
February low and a little greater than 60 points away from spot on Friday afternoon. For a breakdown in DXY to occur, we’d likely need to see a further rise in the heavily weighted EUR (57.6% of DXY basket), which is fully possible given the US/German 10-Yr yield spread is near the narrowest level in 3-months. Over this week, we’ve seen EUR strength and a further narrowing in US/German spreads favoring EUR strength.
Therefore, keep an eye on a higher price in US rates (lower yields) as well as a stronger EUR and Japanese Yen, which recently hit 2017 highs against USD. Such an environment where DXY underperforms would turn price focus below 99.23 to the 50% retracement of the May-January range of 97.87. This price target would likely take price toward the bottom of the corrective channel drawn on the chart below in blue lines. A breakdown below 97.87 could show a longer-term DXY period of weakness is developing.
For traders looking for life in the greenback, resistance comes in at 101.01, the March 13 low. A break above 101.01 would show an overlap from a previous downtrend that could mean a break higher is developing and should be co-joined with EUR weakness. However, a failure for the price to surpass 101.01 could mean upside remains limited, and the price is merely consolidating before another fall instead of reversing higher. In this scenario, further downside is favored.
Interested in Joining Our Analysts, Instructors, or Strategists For a Free Webinar? Register Here

Chart created by Tyler Yell, CMT
---
Shorter-Term DXY Technical Levels for Friday, March 24, 2017
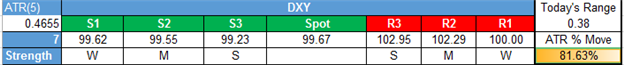
For those interested in shorter-term levels of focus than the ones above, these levels signal important potential pivot levels over the next 48-hours of trading.
T.Y.
DailyFX provides forex news and technical analysis on the trends that influence the global currency markets.
Learn forex trading with a free practice account and trading charts from IG.
