
 Yahoo Finance
 How Does Wagners Holding's (ASX:WGN) P/E Compare To Its Industry, After The Share Price Drop?

Unfortunately for some shareholders, the Wagners Holding (ASX:WGN) share price has dived 65% in the last thirty days. Given the 71% drop over the last year, some shareholders might be worried that they have become bagholders. What is a bagholder? It is a shareholder who has suffered a bad loss, but continues to hold indefinitely, without questioning their reasons for holding, even as the losses grow greater.
All else being equal, a share price drop should make a stock more attractive to potential investors. In the long term, share prices tend to follow earnings per share, but in the short term prices bounce around in response to short term factors (which are not always obvious). So, on certain occasions, long term focussed investors try to take advantage of pessimistic expectations to buy shares at a better price. One way to gauge market expectations of a stock is to look at its Price to Earnings Ratio (PE Ratio). Investors have optimistic expectations of companies with higher P/E ratios, compared to companies with lower P/E ratios.
See our latest analysis for Wagners Holding
Does Wagners Holding Have A Relatively High Or Low P/E For Its Industry?
We can tell from its P/E ratio of 22.66 that there is some investor optimism about Wagners Holding. You can see in the image below that the average P/E (18.8) for companies in the basic materials industry is lower than Wagners Holding's P/E.
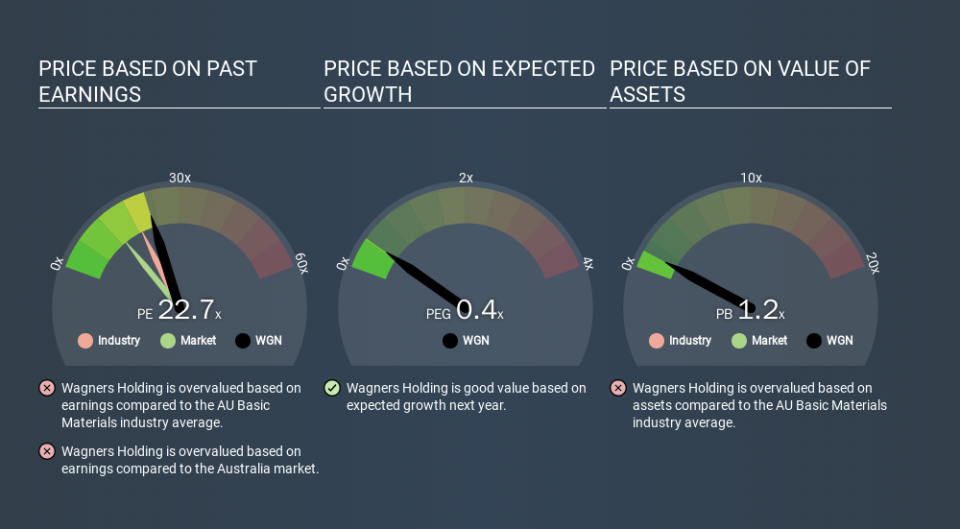
That means that the market expects Wagners Holding will outperform other companies in its industry. Clearly the market expects growth, but it isn't guaranteed. So investors should always consider the P/E ratio alongside other factors, such as whether company directors have been buying shares.
How Growth Rates Impact P/E Ratios
If earnings fall then in the future the 'E' will be lower. That means unless the share price falls, the P/E will increase in a few years. So while a stock may look cheap based on past earnings, it could be expensive based on future earnings.
Wagners Holding's earnings per share fell by 72% in the last twelve months. And EPS is down 43% a year, over the last 3 years. This growth rate might warrant a low P/E ratio.
A Limitation: P/E Ratios Ignore Debt and Cash In The Bank
One drawback of using a P/E ratio is that it considers market capitalization, but not the balance sheet. In other words, it does not consider any debt or cash that the company may have on the balance sheet. In theory, a company can lower its future P/E ratio by using cash or debt to invest in growth.
While growth expenditure doesn't always pay off, the point is that it is a good option to have; but one that the P/E ratio ignores.
How Does Wagners Holding's Debt Impact Its P/E Ratio?
Net debt totals 53% of Wagners Holding's market cap. This is enough debt that you'd have to make some adjustments before using the P/E ratio to compare it to a company with net cash.
The Bottom Line On Wagners Holding's P/E Ratio
Wagners Holding has a P/E of 22.7. That's higher than the average in its market, which is 13.3. With significant debt and no EPS growth last year, shareholders are betting on an improvement in earnings from the company. Given Wagners Holding's P/E ratio has declined from 65.5 to 22.7 in the last month, we know for sure that the market is significantly less confident about the business today, than it was back then. For those who prefer to invest with the flow of momentum, that might be a bad sign, but for a contrarian, it may signal opportunity.
When the market is wrong about a stock, it gives savvy investors an opportunity. People often underestimate remarkable growth -- so investors can make money when fast growth is not fully appreciated. So this free visualization of the analyst consensus on future earnings could help you make the right decision about whether to buy, sell, or hold.
Of course you might be able to find a better stock than Wagners Holding. So you may wish to see this free collection of other companies that have grown earnings strongly.
If you spot an error that warrants correction, please contact the editor at editorial-team@simplywallst.com. This article by Simply Wall St is general in nature. It does not constitute a recommendation to buy or sell any stock, and does not take account of your objectives, or your financial situation. Simply Wall St has no position in the stocks mentioned.
We aim to bring you long-term focused research analysis driven by fundamental data. Note that our analysis may not factor in the latest price-sensitive company announcements or qualitative material. Thank you for reading.
