
 Yahoo Finance
 Does Treasury Wine Estates Limited's (ASX:TWE) Weak Fundamentals Mean That The Market Could Correct Its Share Price?
Most readers would already be aware that Treasury Wine Estates' (ASX:TWE) stock increased significantly by 13% over the past three months. We, however wanted to have a closer look at its key financial indicators as the markets usually pay for long-term fundamentals, and in this case, they don't look very promising. In this article, we decided to focus on Treasury Wine Estates' ROE.
Return on equity or ROE is an important factor to be considered by a shareholder because it tells them how effectively their capital is being reinvested. In other words, it is a profitability ratio which measures the rate of return on the capital provided by the company's shareholders.
See our latest analysis for Treasury Wine Estates
How To Calculate Return On Equity?
ROE can be calculated by using the formula:
Return on Equity = Net Profit (from continuing operations) ÷ Shareholders' Equity
So, based on the above formula, the ROE for Treasury Wine Estates is:
4.9% = AU$233m ÷ AU$4.8b (Based on the trailing twelve months to December 2023).
The 'return' is the amount earned after tax over the last twelve months. One way to conceptualize this is that for each A$1 of shareholders' capital it has, the company made A$0.05 in profit.
What Is The Relationship Between ROE And Earnings Growth?
Thus far, we have learned that ROE measures how efficiently a company is generating its profits. Depending on how much of these profits the company reinvests or "retains", and how effectively it does so, we are then able to assess a company’s earnings growth potential. Generally speaking, other things being equal, firms with a high return on equity and profit retention, have a higher growth rate than firms that don’t share these attributes.
Treasury Wine Estates' Earnings Growth And 4.9% ROE
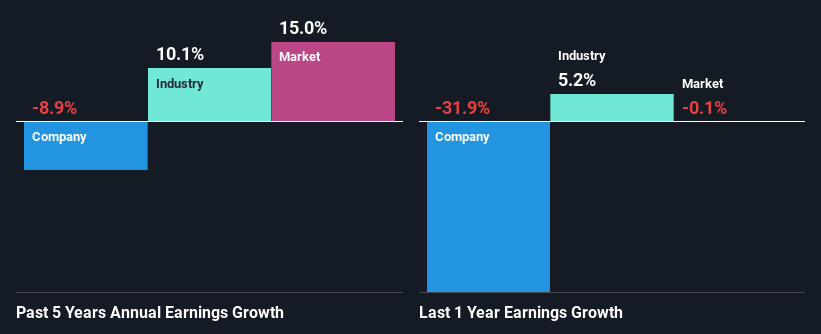
At first glance, Treasury Wine Estates' ROE doesn't look very promising. Next, when compared to the average industry ROE of 12%, the company's ROE leaves us feeling even less enthusiastic. For this reason, Treasury Wine Estates' five year net income decline of 8.9% is not surprising given its lower ROE. We reckon that there could also be other factors at play here. Such as - low earnings retention or poor allocation of capital.
However, when we compared Treasury Wine Estates' growth with the industry we found that while the company's earnings have been shrinking, the industry has seen an earnings growth of 10% in the same period. This is quite worrisome.
The basis for attaching value to a company is, to a great extent, tied to its earnings growth. It’s important for an investor to know whether the market has priced in the company's expected earnings growth (or decline). Doing so will help them establish if the stock's future looks promising or ominous. Has the market priced in the future outlook for TWE? You can find out in our latest intrinsic value infographic research report.
Is Treasury Wine Estates Making Efficient Use Of Its Profits?
With a high three-year median payout ratio of 84% (implying that 16% of the profits are retained), most of Treasury Wine Estates' profits are being paid to shareholders, which explains the company's shrinking earnings. With only a little being reinvested into the business, earnings growth would obviously be low or non-existent. You can see the 4 risks we have identified for Treasury Wine Estates by visiting our risks dashboard for free on our platform here.
Additionally, Treasury Wine Estates has paid dividends over a period of at least ten years, which means that the company's management is determined to pay dividends even if it means little to no earnings growth. Upon studying the latest analysts' consensus data, we found that the company is expected to keep paying out approximately 68% of its profits over the next three years. However, Treasury Wine Estates' ROE is predicted to rise to 12% despite there being no anticipated change in its payout ratio.
Conclusion
In total, we would have a hard think before deciding on any investment action concerning Treasury Wine Estates. Because the company is not reinvesting much into the business, and given the low ROE, it's not surprising to see the lack or absence of growth in its earnings. With that said, we studied the latest analyst forecasts and found that while the company has shrunk its earnings in the past, analysts expect its earnings to grow in the future. To know more about the latest analysts predictions for the company, check out this visualization of analyst forecasts for the company.
Have feedback on this article? Concerned about the content? Get in touch with us directly. Alternatively, email editorial-team (at) simplywallst.com.
This article by Simply Wall St is general in nature. We provide commentary based on historical data and analyst forecasts only using an unbiased methodology and our articles are not intended to be financial advice. It does not constitute a recommendation to buy or sell any stock, and does not take account of your objectives, or your financial situation. We aim to bring you long-term focused analysis driven by fundamental data. Note that our analysis may not factor in the latest price-sensitive company announcements or qualitative material. Simply Wall St has no position in any stocks mentioned.