
 Yahoo Finance
 How Does TransDigm Group's (NYSE:TDG) P/E Compare To Its Industry, After The Share Price Drop?

Unfortunately for some shareholders, the TransDigm Group (NYSE:TDG) share price has dived 37% in the last thirty days. Even longer term holders have taken a real hit with the stock declining 7.5% in the last year.
All else being equal, a share price drop should make a stock more attractive to potential investors. While the market sentiment towards a stock is very changeable, in the long run, the share price will tend to move in the same direction as earnings per share. The implication here is that long term investors have an opportunity when expectations of a company are too low. Perhaps the simplest way to get a read on investors' expectations of a business is to look at its Price to Earnings Ratio (PE Ratio). A high P/E implies that investors have high expectations of what a company can achieve compared to a company with a low P/E ratio.
See our latest analysis for TransDigm Group
How Does TransDigm Group's P/E Ratio Compare To Its Peers?
We can tell from its P/E ratio of 38.08 that there is some investor optimism about TransDigm Group. You can see in the image below that the average P/E (14.5) for companies in the aerospace & defense industry is lower than TransDigm Group's P/E.
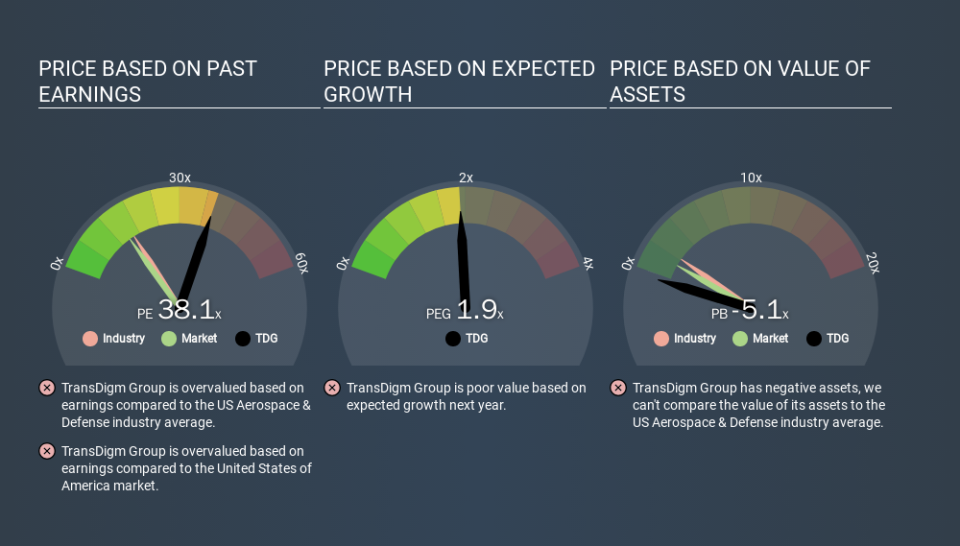
That means that the market expects TransDigm Group will outperform other companies in its industry. The market is optimistic about the future, but that doesn't guarantee future growth. So investors should delve deeper. I like to check if company insiders have been buying or selling.
How Growth Rates Impact P/E Ratios
P/E ratios primarily reflect market expectations around earnings growth rates. If earnings are growing quickly, then the 'E' in the equation will increase faster than it would otherwise. That means even if the current P/E is high, it will reduce over time if the share price stays flat. And as that P/E ratio drops, the company will look cheap, unless its share price increases.
TransDigm Group's earnings per share fell by 28% in the last twelve months. But EPS is up 26% over the last 5 years.
Remember: P/E Ratios Don't Consider The Balance Sheet
The 'Price' in P/E reflects the market capitalization of the company. That means it doesn't take debt or cash into account. Hypothetically, a company could reduce its future P/E ratio by spending its cash (or taking on debt) to achieve higher earnings.
While growth expenditure doesn't always pay off, the point is that it is a good option to have; but one that the P/E ratio ignores.
So What Does TransDigm Group's Balance Sheet Tell Us?
Net debt totals 66% of TransDigm Group's market cap. This is enough debt that you'd have to make some adjustments before using the P/E ratio to compare it to a company with net cash.
The Bottom Line On TransDigm Group's P/E Ratio
TransDigm Group trades on a P/E ratio of 38.1, which is above its market average of 13.3. With meaningful debt and a lack of recent earnings growth, the market has high expectations that the business will earn more in the future. Given TransDigm Group's P/E ratio has declined from 60.8 to 38.1 in the last month, we know for sure that the market is significantly less confident about the business today, than it was back then. For those who don't like to trade against momentum, that could be a warning sign, but a contrarian investor might want to take a closer look.
Investors have an opportunity when market expectations about a stock are wrong. As value investor Benjamin Graham famously said, 'In the short run, the market is a voting machine but in the long run, it is a weighing machine. So this free visualization of the analyst consensus on future earnings could help you make the right decision about whether to buy, sell, or hold.
But note: TransDigm Group may not be the best stock to buy. So take a peek at this free list of interesting companies with strong recent earnings growth (and a P/E ratio below 20).
If you spot an error that warrants correction, please contact the editor at editorial-team@simplywallst.com. This article by Simply Wall St is general in nature. It does not constitute a recommendation to buy or sell any stock, and does not take account of your objectives, or your financial situation. Simply Wall St has no position in the stocks mentioned.
We aim to bring you long-term focused research analysis driven by fundamental data. Note that our analysis may not factor in the latest price-sensitive company announcements or qualitative material. Thank you for reading.
