
 Yahoo Finance
 Does Telstra Corporation Limited's (ASX:TLS) P/E Ratio Signal A Buying Opportunity?

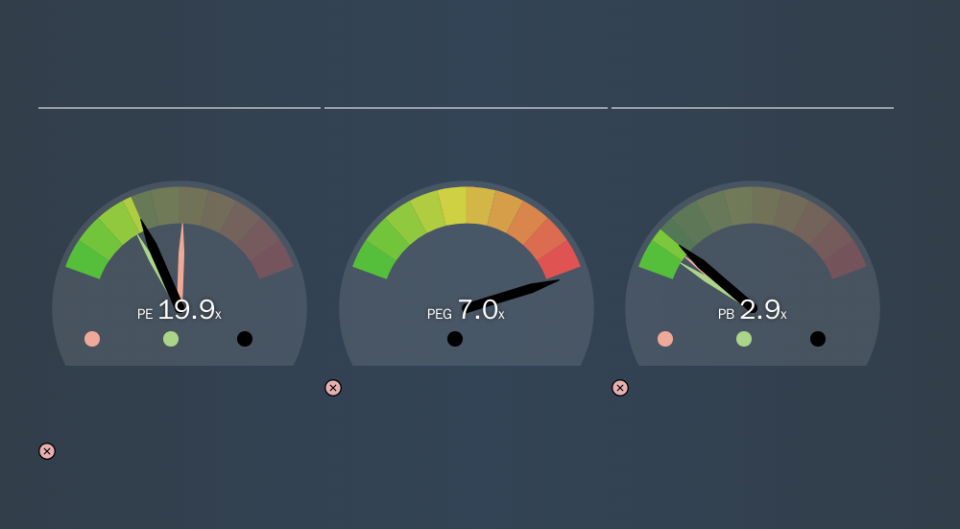
Today, we'll introduce the concept of the P/E ratio for those who are learning about investing. We'll show how you can use Telstra Corporation Limited's (ASX:TLS) P/E ratio to inform your assessment of the investment opportunity. Telstra has a P/E ratio of 19.91, based on the last twelve months. That is equivalent to an earnings yield of about 5.0%.
See our latest analysis for Telstra
How Do I Calculate Telstra's Price To Earnings Ratio?
The formula for price to earnings is:
Price to Earnings Ratio = Share Price ÷ Earnings per Share (EPS)
Or for Telstra:
P/E of 19.91 = A$3.61 ÷ A$0.18 (Based on the trailing twelve months to June 2019.)
Is A High Price-to-Earnings Ratio Good?
A higher P/E ratio implies that investors pay a higher price for the earning power of the business. That isn't a good or a bad thing on its own, but a high P/E means that buyers have a higher opinion of the business's prospects, relative to stocks with a lower P/E.
How Does Telstra's P/E Ratio Compare To Its Peers?
The P/E ratio indicates whether the market has higher or lower expectations of a company. If you look at the image below, you can see Telstra has a lower P/E than the average (30.9) in the telecom industry classification.
Telstra's P/E tells us that market participants think it will not fare as well as its peers in the same industry. Since the market seems unimpressed with Telstra, it's quite possible it could surprise on the upside. If you consider the stock interesting, further research is recommended. For example, I often monitor director buying and selling.
How Growth Rates Impact P/E Ratios
Companies that shrink earnings per share quickly will rapidly decrease the 'E' in the equation. That means unless the share price falls, the P/E will increase in a few years. So while a stock may look cheap based on past earnings, it could be expensive based on future earnings.
Telstra saw earnings per share decrease by 40% last year. And EPS is down 13% a year, over the last 5 years. This might lead to muted expectations.
Don't Forget: The P/E Does Not Account For Debt or Bank Deposits
One drawback of using a P/E ratio is that it considers market capitalization, but not the balance sheet. In other words, it does not consider any debt or cash that the company may have on the balance sheet. Theoretically, a business can improve its earnings (and produce a lower P/E in the future) by investing in growth. That means taking on debt (or spending its cash).
Such spending might be good or bad, overall, but the key point here is that you need to look at debt to understand the P/E ratio in context.
So What Does Telstra's Balance Sheet Tell Us?
Telstra has net debt equal to 39% of its market cap. While it's worth keeping this in mind, it isn't a worry.
The Bottom Line On Telstra's P/E Ratio
Telstra trades on a P/E ratio of 19.9, which is above its market average of 17.2. With a bit of debt, but a lack of recent growth, it's safe to say the market is expecting improved profit performance from the company, in the next few years.
Investors should be looking to buy stocks that the market is wrong about. If the reality for a company is better than it expects, you can make money by buying and holding for the long term. So this free visualization of the analyst consensus on future earnings could help you make the right decision about whether to buy, sell, or hold.
Of course, you might find a fantastic investment by looking at a few good candidates. So take a peek at this free list of companies with modest (or no) debt, trading on a P/E below 20.
We aim to bring you long-term focused research analysis driven by fundamental data. Note that our analysis may not factor in the latest price-sensitive company announcements or qualitative material.
If you spot an error that warrants correction, please contact the editor at editorial-team@simplywallst.com. This article by Simply Wall St is general in nature. It does not constitute a recommendation to buy or sell any stock, and does not take account of your objectives, or your financial situation. Simply Wall St has no position in the stocks mentioned. Thank you for reading.
