
 Yahoo Finance
 Does Sydney Airport Limited’s (ASX:SYD) PE Ratio Warrant A Sell?

This analysis is intended to introduce important early concepts to people who are starting to invest and want to begin learning about how to value company based on its current earnings and what are the drawbacks of this method.
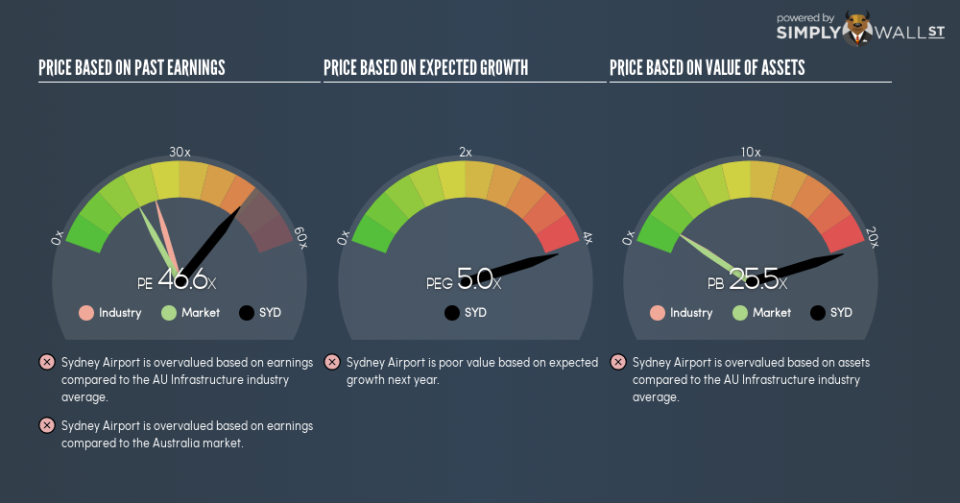
Sydney Airport Limited (ASX:SYD) is trading with a trailing P/E of 46.6x, which is higher than the industry average of 23.1x. While this makes SYD appear like a stock to avoid or sell if you own it, you might change your mind after I explain the assumptions behind the P/E ratio. In this article, I will explain what the P/E ratio is as well as what you should look out for when using it.
See our latest analysis for Sydney Airport
Demystifying the P/E ratio
P/E is a popular ratio used for relative valuation. It compares a stock’s price per share to the stock’s earnings per share. A more intuitive way of understanding the P/E ratio is to think of it as how much investors are paying for each dollar of the company’s earnings.
P/E Calculation for SYD
Price-Earnings Ratio = Price per share ÷ Earnings per share
SYD Price-Earnings Ratio = A$7.25 ÷ A$0.155 = 46.6x
The P/E ratio isn’t a metric you view in isolation and only becomes useful when you compare it against other similar companies. Our goal is to compare the stock’s P/E ratio to the average of companies that have similar attributes to SYD, such as company lifetime and products sold. A common peer group is companies that exist in the same industry, which is what I use. At 46.6x, SYD’s P/E is higher than its industry peers (23.1x). This implies that investors are overvaluing each dollar of SYD’s earnings. This multiple is a median of profitable companies of 5 Infrastructure companies in AU including Traffic Technologies, Atlas Arteria and Auckland International Airport. Therefore, according to this analysis, SYD is an over-priced stock.
Assumptions to be aware of
However, before you rush out to sell your SYD shares, it is important to note that this conclusion is based on two key assumptions. The first is that our “similar companies” are actually similar to SYD, or else the difference in P/E might be a result of other factors. For example, if you are comparing lower risk firms with SYD, then its P/E would naturally be lower than its peers, as investors would value those with lower risk at a higher price. The second assumption that must hold true is that the stocks we are comparing SYD to are fairly valued by the market. If this is violated, SYD’s P/E may be lower than its peers as they are actually overvalued by investors.
What this means for you:
You may have already conducted fundamental analysis on the stock as a shareholder, so its current overvaluation could signal a potential selling opportunity to reduce your exposure to SYD. Now that you understand the ins and outs of the PE metric, you should know to bear in mind its limitations before you make an investment decision. Remember that basing your investment decision off one metric alone is certainly not sufficient. There are many things I have not taken into account in this article and the PE ratio is very one-dimensional. If you have not done so already, I highly recommend you to complete your research by taking a look at the following:
Future Outlook: What are well-informed industry analysts predicting for SYD’s future growth? Take a look at our free research report of analyst consensus for SYD’s outlook.
Past Track Record: Has SYD been consistently performing well irrespective of the ups and downs in the market? Go into more detail in the past performance analysis and take a look at the free visual representations of SYD’s historicals for more clarity.
Other High-Performing Stocks: Are there other stocks that provide better prospects with proven track records? Explore our free list of these great stocks here.
To help readers see past the short term volatility of the financial market, we aim to bring you a long-term focused research analysis purely driven by fundamental data. Note that our analysis does not factor in the latest price-sensitive company announcements.
The author is an independent contributor and at the time of publication had no position in the stocks mentioned. For errors that warrant correction please contact the editor at editorial-team@simplywallst.com.
