
 Yahoo Finance
 Does Super Retail Group Limited (ASX:SUL) Have A Good P/E Ratio?

The goal of this article is to teach you how to use price to earnings ratios (P/E ratios). We'll look at Super Retail Group Limited's (ASX:SUL) P/E ratio and reflect on what it tells us about the company's share price. What is Super Retail Group's P/E ratio? Well, based on the last twelve months it is 14.92. That means that at current prices, buyers pay A$14.92 for every A$1 in trailing yearly profits.
Check out our latest analysis for Super Retail Group
How Do I Calculate A Price To Earnings Ratio?
The formula for price to earnings is:
Price to Earnings Ratio = Price per Share ÷ Earnings per Share (EPS)
Or for Super Retail Group:
P/E of 14.92 = A$10.53 ÷ A$0.71 (Based on the trailing twelve months to June 2019.)
Is A High Price-to-Earnings Ratio Good?
A higher P/E ratio means that buyers have to pay a higher price for each A$1 the company has earned over the last year. That is not a good or a bad thing per se, but a high P/E does imply buyers are optimistic about the future.
Does Super Retail Group Have A Relatively High Or Low P/E For Its Industry?
One good way to get a quick read on what market participants expect of a company is to look at its P/E ratio. The image below shows that Super Retail Group has a lower P/E than the average (16.4) P/E for companies in the specialty retail industry.
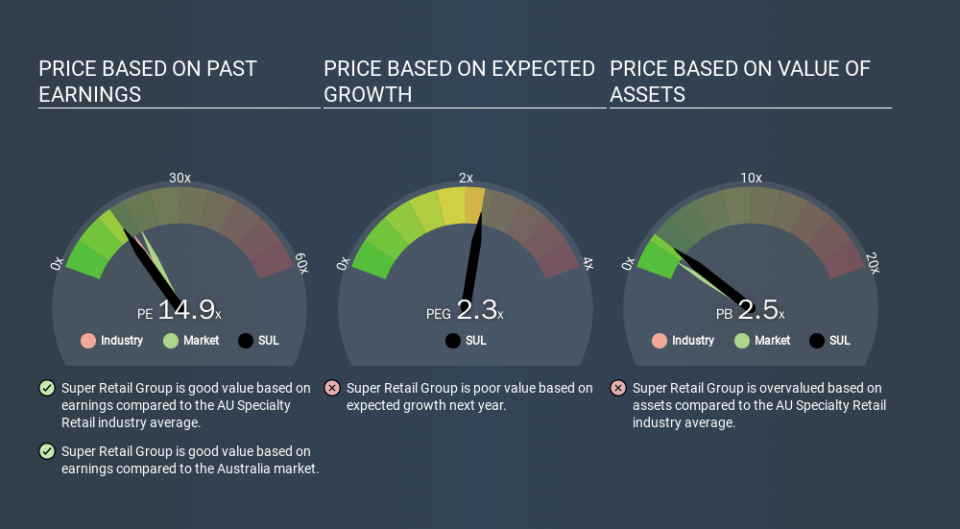
Its relatively low P/E ratio indicates that Super Retail Group shareholders think it will struggle to do as well as other companies in its industry classification. Many investors like to buy stocks when the market is pessimistic about their prospects. You should delve deeper. I like to check if company insiders have been buying or selling.
How Growth Rates Impact P/E Ratios
Probably the most important factor in determining what P/E a company trades on is the earnings growth. That's because companies that grow earnings per share quickly will rapidly increase the 'E' in the equation. Therefore, even if you pay a high multiple of earnings now, that multiple will become lower in the future. Then, a lower P/E should attract more buyers, pushing the share price up.
Super Retail Group saw earnings per share improve by -8.6% last year. And it has bolstered its earnings per share by 4.4% per year over the last five years.
Remember: P/E Ratios Don't Consider The Balance Sheet
The 'Price' in P/E reflects the market capitalization of the company. So it won't reflect the advantage of cash, or disadvantage of debt. Hypothetically, a company could reduce its future P/E ratio by spending its cash (or taking on debt) to achieve higher earnings.
Spending on growth might be good or bad a few years later, but the point is that the P/E ratio does not account for the option (or lack thereof).
So What Does Super Retail Group's Balance Sheet Tell Us?
Super Retail Group has net debt worth 19% of its market capitalization. This could bring some additional risk, and reduce the number of investment options for management; worth remembering if you compare its P/E to businesses without debt.
The Bottom Line On Super Retail Group's P/E Ratio
Super Retail Group has a P/E of 14.9. That's below the average in the AU market, which is 18.8. EPS grew over the last twelve months, and debt levels are quite reasonable. If growth is sustainable over the long term, then the current P/E ratio may be a sign of good value.
Investors have an opportunity when market expectations about a stock are wrong. If the reality for a company is not as bad as the P/E ratio indicates, then the share price should increase as the market realizes this. So this free visualization of the analyst consensus on future earnings could help you make the right decision about whether to buy, sell, or hold.
Of course you might be able to find a better stock than Super Retail Group. So you may wish to see this free collection of other companies that have grown earnings strongly.
If you spot an error that warrants correction, please contact the editor at editorial-team@simplywallst.com. This article by Simply Wall St is general in nature. It does not constitute a recommendation to buy or sell any stock, and does not take account of your objectives, or your financial situation. Simply Wall St has no position in the stocks mentioned.
We aim to bring you long-term focused research analysis driven by fundamental data. Note that our analysis may not factor in the latest price-sensitive company announcements or qualitative material. Thank you for reading.
