
 Yahoo Finance
 Does Stoneridge, Inc.'s (NYSE:SRI) CEO Salary Compare Well With Others?

Jon DeGaynor became the CEO of Stoneridge, Inc. (NYSE:SRI) in 2015. This report will, first, examine the CEO compensation levels in comparison to CEO compensation at companies of similar size. Then we'll look at a snap shot of the business growth. And finally - as a second measure of performance - we will look at the returns shareholders have received over the last few years. This process should give us an idea about how appropriately the CEO is paid.
Check out our latest analysis for Stoneridge
How Does Jon DeGaynor's Compensation Compare With Similar Sized Companies?
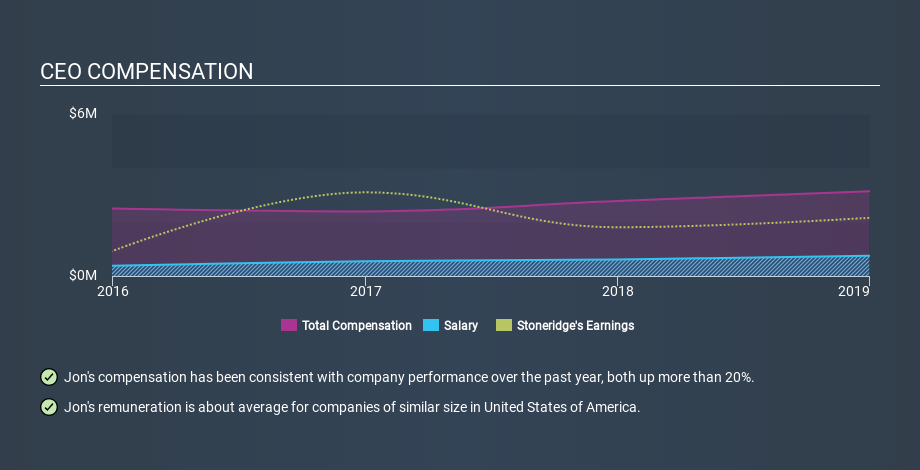
According to our data, Stoneridge, Inc. has a market capitalization of US$785m, and paid its CEO total annual compensation worth US$3.1m over the year to December 2018. While we always look at total compensation first, we note that the salary component is less, at US$750k. We further remind readers that the CEO may face performance requirements to receive the non-salary part of the total compensation. We examined companies with market caps from US$400m to US$1.6b, and discovered that the median CEO total compensation of that group was US$2.5m.
So Jon DeGaynor is paid around the average of the companies we looked at. This doesn't tell us a whole lot on its own, but looking at the performance of the actual business will give us useful context.
The graphic below shows how CEO compensation at Stoneridge has changed from year to year.
Is Stoneridge, Inc. Growing?
On average over the last three years, Stoneridge, Inc. has shrunk earnings per share by 1.5% each year (measured with a line of best fit). The trailing twelve months of revenue was pretty much the same as the prior period.
The lack of earnings per share growth in the last three years is unimpressive. And the flat revenue hardly impresses. It's hard to argue the company is firing on all cylinders, so shareholders might be averse to high CEO remuneration. Shareholders might be interested in this free visualization of analyst forecasts.
Has Stoneridge, Inc. Been A Good Investment?
Boasting a total shareholder return of 68% over three years, Stoneridge, Inc. has done well by shareholders. This strong performance might mean some shareholders don't mind if the CEO were to be paid more than is normal for a company of its size.
In Summary...
Jon DeGaynor is paid around the same as most CEOs of similar size companies.
The company isn't growing earnings per share, but shareholder returns have been strong over the last three years. So we can't see a reason to suggest the pay is inappropriate. Shareholders may want to check for free if Stoneridge insiders are buying or selling shares.
Arguably, business quality is much more important than CEO compensation levels. So check out this free list of interesting companies, that have HIGH return on equity and low debt.
If you spot an error that warrants correction, please contact the editor at editorial-team@simplywallst.com. This article by Simply Wall St is general in nature. It does not constitute a recommendation to buy or sell any stock, and does not take account of your objectives, or your financial situation. Simply Wall St has no position in the stocks mentioned.
We aim to bring you long-term focused research analysis driven by fundamental data. Note that our analysis may not factor in the latest price-sensitive company announcements or qualitative material. Thank you for reading.
