
 Yahoo Finance
 Does Steadfast Group Limited's (ASX:SDF) Weak Fundamentals Mean That The Market Could Correct Its Share Price?
Steadfast Group (ASX:SDF) has had a great run on the share market with its stock up by a significant 8.3% over the last month. However, in this article, we decided to focus on its weak fundamentals, as long-term financial performance of a business is what ultimatley dictates market outcomes. In this article, we decided to focus on Steadfast Group's ROE.
Return on Equity or ROE is a test of how effectively a company is growing its value and managing investors’ money. In other words, it is a profitability ratio which measures the rate of return on the capital provided by the company's shareholders.
See our latest analysis for Steadfast Group
How To Calculate Return On Equity?
The formula for ROE is:
Return on Equity = Net Profit (from continuing operations) ÷ Shareholders' Equity
So, based on the above formula, the ROE for Steadfast Group is:
9.2% = AU$110m ÷ AU$1.2b (Based on the trailing twelve months to December 2020).
The 'return' is the profit over the last twelve months. One way to conceptualize this is that for each A$1 of shareholders' capital it has, the company made A$0.09 in profit.
What Has ROE Got To Do With Earnings Growth?
Thus far, we have learned that ROE measures how efficiently a company is generating its profits. Depending on how much of these profits the company reinvests or "retains", and how effectively it does so, we are then able to assess a company’s earnings growth potential. Assuming everything else remains unchanged, the higher the ROE and profit retention, the higher the growth rate of a company compared to companies that don't necessarily bear these characteristics.
Steadfast Group's Earnings Growth And 9.2% ROE
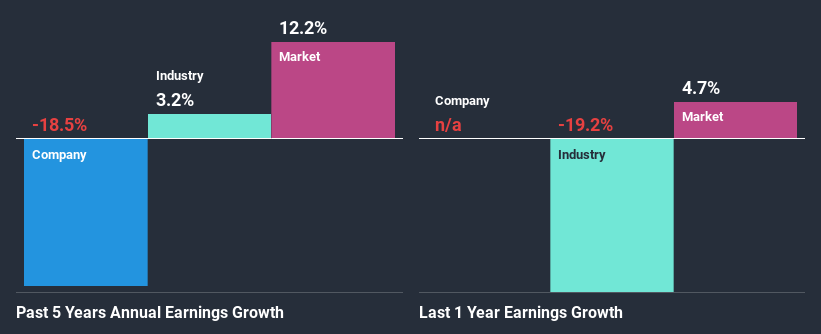
When you first look at it, Steadfast Group's ROE doesn't look that attractive. Yet, a closer study shows that the company's ROE is similar to the industry average of 9.2%. But Steadfast Group saw a five year net income decline of 18% over the past five years. Bear in mind, the company does have a slightly low ROE. So that's what might be causing earnings growth to shrink.
That being said, we compared Steadfast Group's performance with the industry and were concerned when we found that while the company has shrunk its earnings, the industry has grown its earnings at a rate of 3.2% in the same period.
Earnings growth is a huge factor in stock valuation. It’s important for an investor to know whether the market has priced in the company's expected earnings growth (or decline). By doing so, they will have an idea if the stock is headed into clear blue waters or if swampy waters await. One good indicator of expected earnings growth is the P/E ratio which determines the price the market is willing to pay for a stock based on its earnings prospects. So, you may want to check if Steadfast Group is trading on a high P/E or a low P/E, relative to its industry.
Is Steadfast Group Efficiently Re-investing Its Profits?
Steadfast Group has a high three-year median payout ratio of 76% (that is, it is retaining 24% of its profits). This suggests that the company is paying most of its profits as dividends to its shareholders. This goes some way in explaining why its earnings have been shrinking. With only very little left to reinvest into the business, growth in earnings is far from likely. You can see the 3 risks we have identified for Steadfast Group by visiting our risks dashboard for free on our platform here.
Additionally, Steadfast Group has paid dividends over a period of seven years, which means that the company's management is rather focused on keeping up its dividend payments, regardless of the shrinking earnings. Based on the latest analysts' estimates, we found that the company's future payout ratio over the next three years is expected to hold steady at 69%. Regardless, the future ROE for Steadfast Group is predicted to rise to 12% despite there being not much change expected in its payout ratio.
Conclusion
On the whole, Steadfast Group's performance is quite a big let-down. Because the company is not reinvesting much into the business, and given the low ROE, it's not surprising to see the lack or absence of growth in its earnings. With that said, we studied the latest analyst forecasts and found that while the company has shrunk its earnings in the past, analysts expect its earnings to grow in the future. To know more about the latest analysts predictions for the company, check out this visualization of analyst forecasts for the company.
This article by Simply Wall St is general in nature. It does not constitute a recommendation to buy or sell any stock, and does not take account of your objectives, or your financial situation. We aim to bring you long-term focused analysis driven by fundamental data. Note that our analysis may not factor in the latest price-sensitive company announcements or qualitative material. Simply Wall St has no position in any stocks mentioned.
Have feedback on this article? Concerned about the content? Get in touch with us directly. Alternatively, email editorial-team (at) simplywallst.com.
