
 Yahoo Finance
 How Does Stamps.com's (NASDAQ:STMP) P/E Compare To Its Industry, After Its Big Share Price Gain?

It's really great to see that even after a strong run, Stamps.com (NASDAQ:STMP) shares have been powering on, with a gain of 47% in the last thirty days. The 383% gain over the last year is certainly lovely to see, just like a wink and smile from your sweetheart.
Assuming no other changes, a sharply higher share price makes a stock less attractive to potential buyers. While the market sentiment towards a stock is very changeable, in the long run, the share price will tend to move in the same direction as earnings per share. So some would prefer to hold off buying when there is a lot of optimism towards a stock. One way to gauge market expectations of a stock is to look at its Price to Earnings Ratio (PE Ratio). A high P/E implies that investors have high expectations of what a company can achieve compared to a company with a low P/E ratio.
See our latest analysis for Stamps.com
Does Stamps.com Have A Relatively High Or Low P/E For Its Industry?
Stamps.com's P/E of 57.98 indicates some degree of optimism towards the stock. You can see in the image below that the average P/E (21.5) for companies in the online retail industry is lower than Stamps.com's P/E.
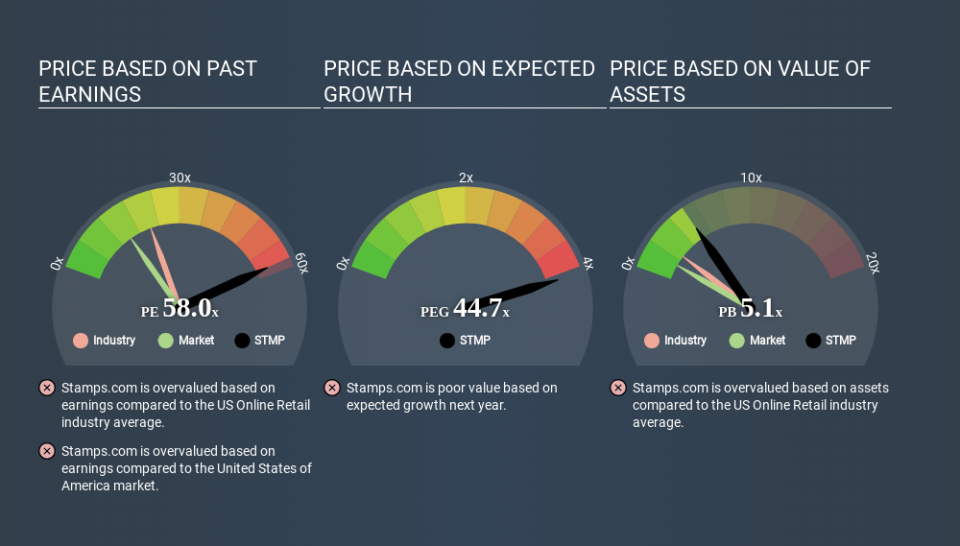
Stamps.com's P/E tells us that market participants think the company will perform better than its industry peers, going forward. Shareholders are clearly optimistic, but the future is always uncertain. So investors should delve deeper. I like to check if company insiders have been buying or selling.
How Growth Rates Impact P/E Ratios
Companies that shrink earnings per share quickly will rapidly decrease the 'E' in the equation. That means even if the current P/E is low, it will increase over time if the share price stays flat. Then, a higher P/E might scare off shareholders, pushing the share price down.
Stamps.com saw earnings per share decrease by 54% last year. But over the longer term (5 years) earnings per share have increased by 14%. And EPS is down 14% a year, over the last 3 years. This growth rate might warrant a low P/E ratio.
Don't Forget: The P/E Does Not Account For Debt or Bank Deposits
The 'Price' in P/E reflects the market capitalization of the company. So it won't reflect the advantage of cash, or disadvantage of debt. The exact same company would hypothetically deserve a higher P/E ratio if it had a strong balance sheet, than if it had a weak one with lots of debt, because a cashed up company can spend on growth.
While growth expenditure doesn't always pay off, the point is that it is a good option to have; but one that the P/E ratio ignores.
Is Debt Impacting Stamps.com's P/E?
Since Stamps.com holds net cash of US$152m, it can spend on growth, justifying a higher P/E ratio than otherwise.
The Verdict On Stamps.com's P/E Ratio
Stamps.com's P/E is 58.0 which suggests the market is more focussed on the future opportunity rather than the current level of earnings. Falling earnings per share is probably keeping traditional value investors away, but the healthy balance sheet means the company retains the potential for future growth. If this growth fails to materialise, the current high P/E could prove to be temporary, as the share price falls. What is very clear is that the market has become significantly more optimistic about Stamps.com over the last month, with the P/E ratio rising from 39.6 back then to 58.0 today. For those who prefer to invest with the flow of momentum, that might mean it's time to put the stock on a watchlist, or research it. But the contrarian may see it as a missed opportunity.
Investors should be looking to buy stocks that the market is wrong about. If the reality for a company is better than it expects, you can make money by buying and holding for the long term. So this free report on the analyst consensus forecasts could help you make a master move on this stock.
You might be able to find a better buy than Stamps.com. If you want a selection of possible winners, check out this free list of interesting companies that trade on a P/E below 20 (but have proven they can grow earnings).
If you spot an error that warrants correction, please contact the editor at editorial-team@simplywallst.com. This article by Simply Wall St is general in nature. It does not constitute a recommendation to buy or sell any stock, and does not take account of your objectives, or your financial situation. Simply Wall St has no position in the stocks mentioned.
We aim to bring you long-term focused research analysis driven by fundamental data. Note that our analysis may not factor in the latest price-sensitive company announcements or qualitative material. Thank you for reading.
