
 Yahoo Finance
 Does South32 Limited’s (ASX:S32) Debt Level Pose A Problem?

South32 Limited (ASX:S32), a large-cap worth AU$19.53B, comes to mind for investors seeking a strong and reliable stock investment. Market participants who are conscious of risk tend to search for large firms, attracted by the prospect of varied revenue sources and strong returns on capital. However, the key to their continued success lies in its financial health. I will provide an overview of South32’s financial liquidity and leverage to give you an idea of South32’s position to take advantage of potential acquisitions or comfortably endure future downturns. Remember this is a very top-level look that focuses exclusively on financial health, so I recommend a deeper analysis into S32 here. See our latest analysis for South32
How does S32’s operating cash flow stack up against its debt?
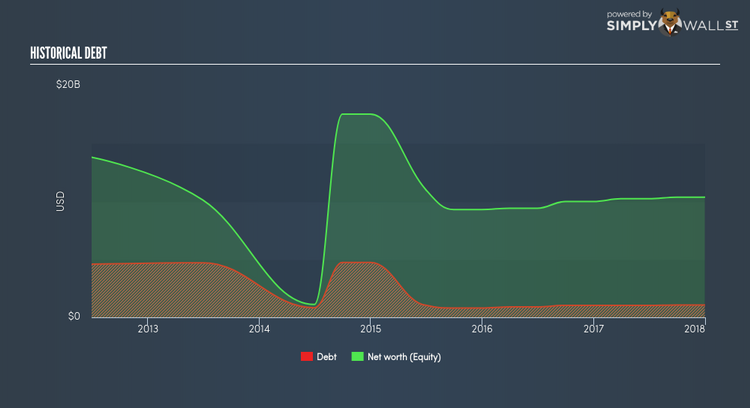
S32’s debt levels surged from US$913.00M to US$1.04B over the last 12 months , which comprises of short- and long-term debt. With this increase in debt, S32’s cash and short-term investments stands at US$2.71B for investing into the business. Moreover, S32 has generated cash from operations of US$2.13B during the same period of time, leading to an operating cash to total debt ratio of 205.99%, signalling that S32’s operating cash is sufficient to cover its debt. This ratio can also be interpreted as a measure of efficiency as an alternative to return on assets. In S32’s case, it is able to generate 2.06x cash from its debt capital.
Can S32 meet its short-term obligations with the cash in hand?
With current liabilities at US$1.74B, the company has been able to meet these commitments with a current assets level of US$4.33B, leading to a 2.48x current account ratio. Usually, for Metals and Mining companies, this is a suitable ratio since there’s sufficient cash cushion without leaving too much capital idle or in low-earning investments.
Can S32 service its debt comfortably?
With debt at 10.25% of equity, S32 may be thought of as appropriately levered. This range is considered safe as S32 is not taking on too much debt obligation, which can be restrictive and risky for equity-holders.
Next Steps:
S32 has demonstrated its ability to generate sufficient levels of cash flow, while its debt hovers at a safe level. Furthermore, the company exhibits an ability to meet its near-term obligations, which isn’t a big surprise for a large-cap. I admit this is a fairly basic analysis for S32’s financial health. Other important fundamentals need to be considered alongside. I suggest you continue to research South32 to get a better picture of the stock by looking at:
Future Outlook: What are well-informed industry analysts predicting for S32’s future growth? Take a look at our free research report of analyst consensus for S32’s outlook.
Valuation: What is S32 worth today? Is the stock undervalued, even when its growth outlook is factored into its intrinsic value? The intrinsic value infographic in our free research report helps visualize whether S32 is currently mispriced by the market.
Other High-Performing Stocks: Are there other stocks that provide better prospects with proven track records? Explore our free list of these great stocks here.
To help readers see pass the short term volatility of the financial market, we aim to bring you a long-term focused research analysis purely driven by fundamental data. Note that our analysis does not factor in the latest price sensitive company announcements.
The author is an independent contributor and at the time of publication had no position in the stocks mentioned.
