
 Yahoo Finance
 Does It Make Sense To Buy Bed Bath & Beyond Inc. (NASDAQ:BBBY) For Its Yield?

Could Bed Bath & Beyond Inc. (NASDAQ:BBBY) be an attractive dividend share to own for the long haul? Investors are often drawn to strong companies with the idea of reinvesting the dividends. If you are hoping to live on the income from dividends, it's important to be a lot more stringent with your investments than the average punter.
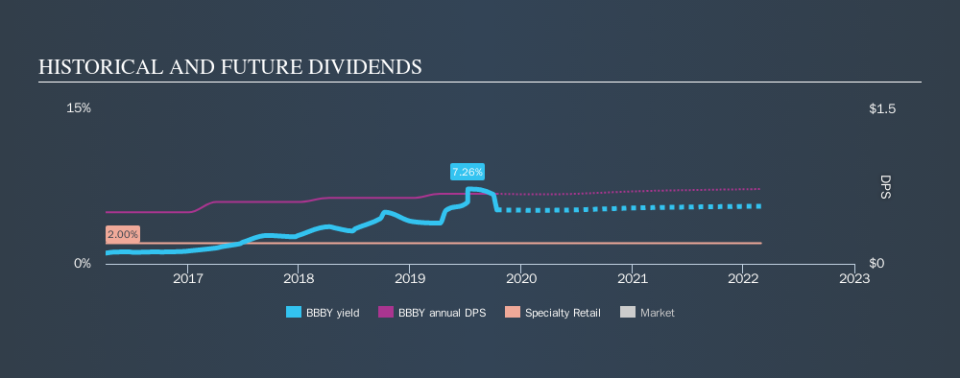
In this case, Bed Bath & Beyond likely looks attractive to dividend investors, given its 5.2% dividend yield and four-year payment history. It sure looks interesting on these metrics - but there's always more to the story . The company also bought back stock equivalent to around 11% of market capitalisation this year. When buying stocks for their dividends, you should always run through the checks below, to see if the dividend looks sustainable.
Click the interactive chart for our full dividend analysis
Payout ratios
Companies (usually) pay dividends out of their earnings. If a company is paying more than it earns, the dividend might have to be cut. As a result, we should always investigate whether a company can afford its dividend, measured as a percentage of a company's net income after tax. Although it reported a loss over the past 12 months, Bed Bath & Beyond currently pays a dividend. When a company recently reported a loss, we should investigate if its cash flows covered the dividend.
Of the free cash flow it generated last year, Bed Bath & Beyond paid out 32% as dividends, suggesting the dividend is affordable.
Is Bed Bath & Beyond's Balance Sheet Risky?
Given Bed Bath & Beyond is paying a dividend but reported a loss over the past year, we need to check its balance sheet for signs of financial distress. A quick check of its financial situation can be done with two ratios: net debt divided by EBITDA (earnings before interest, tax, depreciation and amortisation), and net interest cover. Net debt to EBITDA is a measure of a company's total debt. Net interest cover measures the ability to meet interest payments. Essentially we check that a) the company does not have too much debt, and b) that it can afford to pay the interest. Bed Bath & Beyond has net debt of 0.99 times its EBITDA, which is generally an okay level of debt for most companies.
We calculated its interest cover by measuring its earnings before interest and tax (EBIT), and dividing this by the company's net interest expense. Interest cover of 2.44 times its interest expense is starting to become a concern for Bed Bath & Beyond, and be aware that lenders may place additional restrictions on the company as well.
Remember, you can always get a snapshot of Bed Bath & Beyond's latest financial position, by checking our visualisation of its financial health.
Dividend Volatility
Before buying a stock for its income, we want to see if the dividends have been stable in the past, and if the company has a track record of maintaining its dividend. Looking at the data, we can see that Bed Bath & Beyond has been paying a dividend for the past four years. The company has been paying a stable dividend for a few years now, but we'd like to see more evidence of consistency over a longer period. During the past four-year period, the first annual payment was US$0.50 in 2015, compared to US$0.68 last year. Dividends per share have grown at approximately 8.0% per year over this time.
Bed Bath & Beyond has been growing its dividend at a decent rate, and the payments have been stable despite the short payment history. This is a positive start.
Dividend Growth Potential
Dividend payments have been consistent over the past few years, but we should always check if earnings per share (EPS) are growing, as this will help maintain the purchasing power of the dividend. Bed Bath & Beyond's earnings per share have shrunk at 37% a year over the past five years. With this kind of significant decline, we always wonder what has changed in the business. Dividends are about stability, and Bed Bath & Beyond's earnings per share, which support the dividend, have been anything but stable.
Conclusion
Dividend investors should always want to know if a) a company's dividends are affordable, b) if there is a track record of consistent payments, and c) if the dividend is capable of growing. We're not keen on the fact that Bed Bath & Beyond paid dividends despite reporting a loss over the past year, although fortunately its dividend was covered by cash flow. Second, earnings per share have been in decline, and the dividend history is shorter than we'd like. In summary, Bed Bath & Beyond has a number of shortcomings that we'd find it hard to get past. Things could change, but we think there are likely more attractive alternatives out there.
Without at least some growth in earnings per share over time, the dividend will eventually come under pressure either from costs or inflation. See if the 19 analysts are forecasting a turnaround in our free collection of analyst estimates here.
We have also put together a list of global stocks with a market capitalisation above $1bn and yielding more 3%.
We aim to bring you long-term focused research analysis driven by fundamental data. Note that our analysis may not factor in the latest price-sensitive company announcements or qualitative material.
If you spot an error that warrants correction, please contact the editor at editorial-team@simplywallst.com. This article by Simply Wall St is general in nature. It does not constitute a recommendation to buy or sell any stock, and does not take account of your objectives, or your financial situation. Simply Wall St has no position in the stocks mentioned. Thank you for reading.
