
 Yahoo Finance
 How Does Science Applications International's (NYSE:SAIC) P/E Compare To Its Industry, After Its Big Share Price Gain?

Science Applications International (NYSE:SAIC) shareholders are no doubt pleased to see that the share price has bounced 57% in the last month alone, although it is still down 11% over the last quarter. The full year gain of 11% is pretty reasonable, too.
Assuming no other changes, a sharply higher share price makes a stock less attractive to potential buyers. While the market sentiment towards a stock is very changeable, in the long run, the share price will tend to move in the same direction as earnings per share. So some would prefer to hold off buying when there is a lot of optimism towards a stock. One way to gauge market expectations of a stock is to look at its Price to Earnings Ratio (PE Ratio). A high P/E ratio means that investors have a high expectation about future growth, while a low P/E ratio means they have low expectations about future growth.
Check out our latest analysis for Science Applications International
Does Science Applications International Have A Relatively High Or Low P/E For Its Industry?
Science Applications International's P/E of 21.18 indicates relatively low sentiment towards the stock. We can see in the image below that the average P/E (27.3) for companies in the it industry is higher than Science Applications International's P/E.
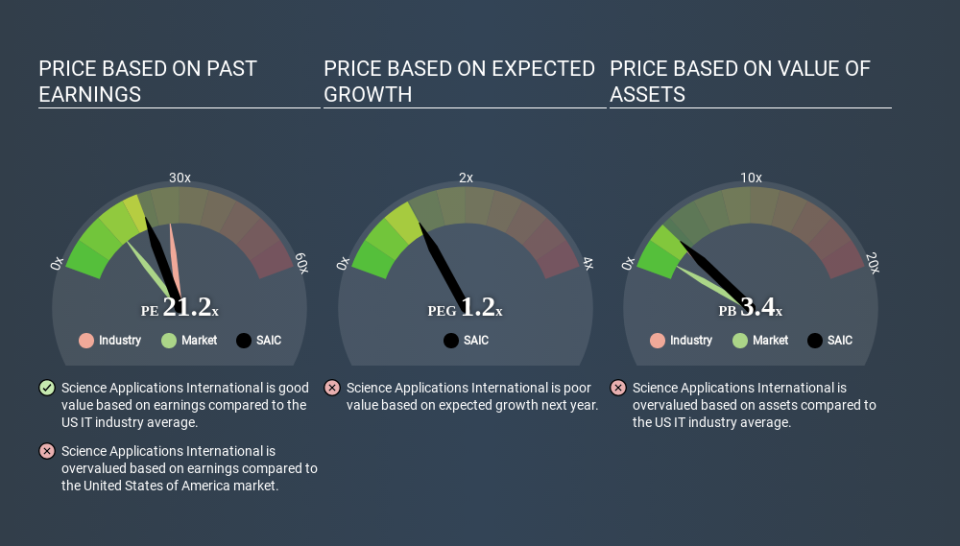
Science Applications International's P/E tells us that market participants think it will not fare as well as its peers in the same industry. Since the market seems unimpressed with Science Applications International, it's quite possible it could surprise on the upside. It is arguably worth checking if insiders are buying shares, because that might imply they believe the stock is undervalued.
How Growth Rates Impact P/E Ratios
P/E ratios primarily reflect market expectations around earnings growth rates. That's because companies that grow earnings per share quickly will rapidly increase the 'E' in the equation. That means unless the share price increases, the P/E will reduce in a few years. So while a stock may look expensive based on past earnings, it could be cheap based on future earnings.
Most would be impressed by Science Applications International earnings growth of 22% in the last year. And its annual EPS growth rate over 5 years is 5.2%. With that performance, you might expect an above average P/E ratio.
Don't Forget: The P/E Does Not Account For Debt or Bank Deposits
One drawback of using a P/E ratio is that it considers market capitalization, but not the balance sheet. So it won't reflect the advantage of cash, or disadvantage of debt. In theory, a company can lower its future P/E ratio by using cash or debt to invest in growth.
While growth expenditure doesn't always pay off, the point is that it is a good option to have; but one that the P/E ratio ignores.
So What Does Science Applications International's Balance Sheet Tell Us?
Science Applications International has net debt equal to 38% of its market cap. You'd want to be aware of this fact, but it doesn't bother us.
The Bottom Line On Science Applications International's P/E Ratio
Science Applications International has a P/E of 21.2. That's higher than the average in its market, which is 13.6. While the company does use modest debt, its recent earnings growth is very good. Therefore, it's not particularly surprising that it has a above average P/E ratio. What is very clear is that the market has become significantly more optimistic about Science Applications International over the last month, with the P/E ratio rising from 13.5 back then to 21.2 today. For those who prefer to invest with the flow of momentum, that might mean it's time to put the stock on a watchlist, or research it. But the contrarian may see it as a missed opportunity.
When the market is wrong about a stock, it gives savvy investors an opportunity. People often underestimate remarkable growth -- so investors can make money when fast growth is not fully appreciated. So this free visualization of the analyst consensus on future earnings could help you make the right decision about whether to buy, sell, or hold.
Of course you might be able to find a better stock than Science Applications International. So you may wish to see this free collection of other companies that have grown earnings strongly.
If you spot an error that warrants correction, please contact the editor at editorial-team@simplywallst.com. This article by Simply Wall St is general in nature. It does not constitute a recommendation to buy or sell any stock, and does not take account of your objectives, or your financial situation. Simply Wall St has no position in the stocks mentioned.
We aim to bring you long-term focused research analysis driven by fundamental data. Note that our analysis may not factor in the latest price-sensitive company announcements or qualitative material. Thank you for reading.
