
 Yahoo Finance
 Does Royal Gold, Inc.'s (NASDAQ:RGLD) CEO Salary Compare Well With Others?

Tony Jensen has been the CEO of Royal Gold, Inc. (NASDAQ:RGLD) since 2006. This report will, first, examine the CEO compensation levels in comparison to CEO compensation at companies of similar size. Then we'll look at a snap shot of the business growth. And finally - as a second measure of performance - we will look at the returns shareholders have received over the last few years. This process should give us an idea about how appropriately the CEO is paid.
Check out our latest analysis for Royal Gold
How Does Tony Jensen's Compensation Compare With Similar Sized Companies?
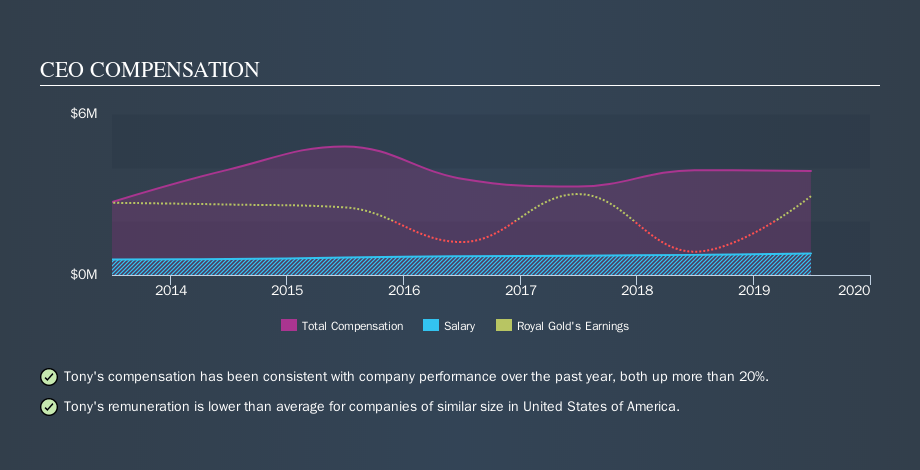
According to our data, Royal Gold, Inc. has a market capitalization of US$7.8b, and paid its CEO total annual compensation worth US$3.9m over the year to June 2019. That's below the compensation, last year. While this analysis focuses on total compensation, it's worth noting the salary is lower, valued at US$800k. We note that more than half of the total compensation is not the salary; and performance requirements may apply to this non-salary portion. We examined companies with market caps from US$4.0b to US$12b, and discovered that the median CEO total compensation of that group was US$6.9m.
A first glance this seems like a real positive for shareholders, since Tony Jensen is paid less than the average total compensation paid by similar sized companies. While this is a good thing, you'll need to understand the business better before you can form an opinion.
You can see, below, how CEO compensation at Royal Gold has changed over time.
Is Royal Gold, Inc. Growing?
On average over the last three years, Royal Gold, Inc. has shrunk earnings per share by 5.9% each year (measured with a line of best fit). In the last year, its revenue is down 8.3%.
Sadly for shareholders, earnings per share are actually down, over three years. And the impression is worse when you consider revenue is down year-on-year. These factors suggest that the business performance wouldn't really justify a high pay packet for the CEO. You might want to check this free visual report on analyst forecasts for future earnings.
Has Royal Gold, Inc. Been A Good Investment?
Boasting a total shareholder return of 80% over three years, Royal Gold, Inc. has done well by shareholders. This strong performance might mean some shareholders don't mind if the CEO were to be paid more than is normal for a company of its size.
In Summary...
Royal Gold, Inc. is currently paying its CEO below what is normal for companies of its size.
Tony Jensen receives relatively low remuneration compared to similar sized companies. And while the company isn't growing earnings per share, total returns have been pleasing. So, while it would be nice to have EPS growth, on our analysis the CEO compensation is not an issue. CEO compensation is one thing, but it is also interesting to check if the CEO is buying or selling Royal Gold (free visualization of insider trades).
If you want to buy a stock that is better than Royal Gold, this free list of high return, low debt companies is a great place to look.
We aim to bring you long-term focused research analysis driven by fundamental data. Note that our analysis may not factor in the latest price-sensitive company announcements or qualitative material.
If you spot an error that warrants correction, please contact the editor at editorial-team@simplywallst.com. This article by Simply Wall St is general in nature. It does not constitute a recommendation to buy or sell any stock, and does not take account of your objectives, or your financial situation. Simply Wall St has no position in the stocks mentioned. Thank you for reading.
