
 Yahoo Finance
 What Does RBC Bearings Incorporated's (NASDAQ:ROLL) P/E Ratio Tell You?

The goal of this article is to teach you how to use price to earnings ratios (P/E ratios). We'll show how you can use RBC Bearings Incorporated's (NASDAQ:ROLL) P/E ratio to inform your assessment of the investment opportunity. What is RBC Bearings's P/E ratio? Well, based on the last twelve months it is 35.54. That corresponds to an earnings yield of approximately 2.8%.
Check out our latest analysis for RBC Bearings
How Do You Calculate A P/E Ratio?
The formula for P/E is:
Price to Earnings Ratio = Price per Share ÷ Earnings per Share (EPS)
Or for RBC Bearings:
P/E of 35.54 = $157.32 ÷ $4.43 (Based on the year to June 2019.)
Is A High Price-to-Earnings Ratio Good?
A higher P/E ratio means that investors are paying a higher price for each $1 of company earnings. That isn't a good or a bad thing on its own, but a high P/E means that buyers have a higher opinion of the business's prospects, relative to stocks with a lower P/E.
Does RBC Bearings Have A Relatively High Or Low P/E For Its Industry?
We can get an indication of market expectations by looking at the P/E ratio. You can see in the image below that the average P/E (20.0) for companies in the machinery industry is lower than RBC Bearings's P/E.
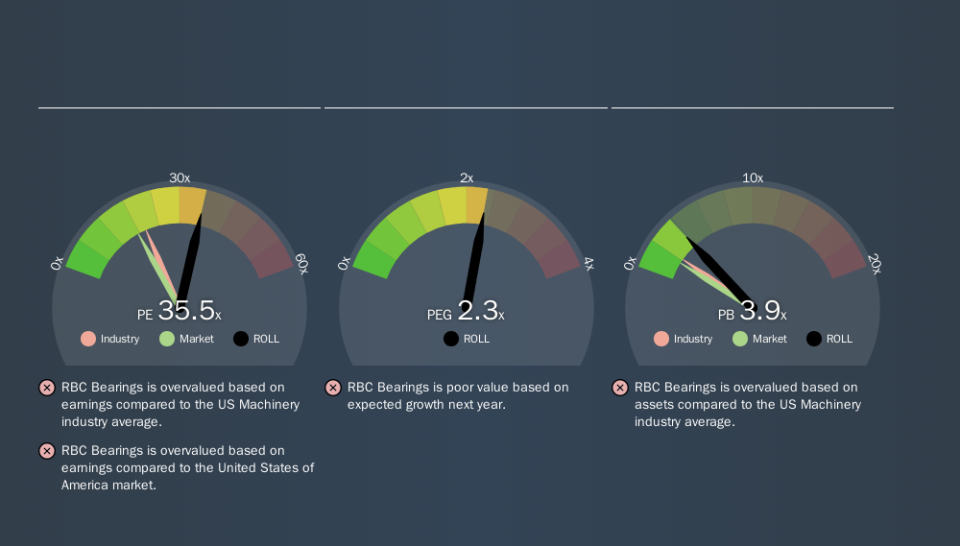
RBC Bearings's P/E tells us that market participants think the company will perform better than its industry peers, going forward. Shareholders are clearly optimistic, but the future is always uncertain. So further research is always essential. I often monitor director buying and selling.
How Growth Rates Impact P/E Ratios
Generally speaking the rate of earnings growth has a profound impact on a company's P/E multiple. That's because companies that grow earnings per share quickly will rapidly increase the 'E' in the equation. That means unless the share price increases, the P/E will reduce in a few years. Then, a lower P/E should attract more buyers, pushing the share price up.
It's great to see that RBC Bearings grew EPS by 15% in the last year. And its annual EPS growth rate over 5 years is 11%. So one might expect an above average P/E ratio.
A Limitation: P/E Ratios Ignore Debt and Cash In The Bank
One drawback of using a P/E ratio is that it considers market capitalization, but not the balance sheet. So it won't reflect the advantage of cash, or disadvantage of debt. In theory, a company can lower its future P/E ratio by using cash or debt to invest in growth.
Such spending might be good or bad, overall, but the key point here is that you need to look at debt to understand the P/E ratio in context.
RBC Bearings's Balance Sheet
RBC Bearings has net cash of US$6.4m. That should lead to a higher P/E than if it did have debt, because its strong balance sheets gives it more options.
The Verdict On RBC Bearings's P/E Ratio
RBC Bearings has a P/E of 35.5. That's higher than the average in its market, which is 17.6. Its strong balance sheet gives the company plenty of resources for extra growth, and it has already proven it can grow. So it does not seem strange that the P/E is above average.
Investors should be looking to buy stocks that the market is wrong about. If the reality for a company is better than it expects, you can make money by buying and holding for the long term. So this free report on the analyst consensus forecasts could help you make a master move on this stock.
You might be able to find a better buy than RBC Bearings. If you want a selection of possible winners, check out this free list of interesting companies that trade on a P/E below 20 (but have proven they can grow earnings).
We aim to bring you long-term focused research analysis driven by fundamental data. Note that our analysis may not factor in the latest price-sensitive company announcements or qualitative material.
If you spot an error that warrants correction, please contact the editor at editorial-team@simplywallst.com. This article by Simply Wall St is general in nature. It does not constitute a recommendation to buy or sell any stock, and does not take account of your objectives, or your financial situation. Simply Wall St has no position in the stocks mentioned. Thank you for reading.
