
 Yahoo Finance
 How Does Qudian's (NYSE:QD) P/E Compare To Its Industry, After The Share Price Drop?

Unfortunately for some shareholders, the Qudian (NYSE:QD) share price has dived 32% in the last thirty days. Even longer term holders have taken a real hit with the stock declining 5.8% in the last year.
Assuming nothing else has changed, a lower share price makes a stock more attractive to potential buyers. While the market sentiment towards a stock is very changeable, in the long run, the share price will tend to move in the same direction as earnings per share. The implication here is that long term investors have an opportunity when expectations of a company are too low. One way to gauge market expectations of a stock is to look at its Price to Earnings Ratio (PE Ratio). A high P/E ratio means that investors have a high expectation about future growth, while a low P/E ratio means they have low expectations about future growth.
View our latest analysis for Qudian
How Does Qudian's P/E Ratio Compare To Its Peers?
Qudian's P/E of 2.45 indicates relatively low sentiment towards the stock. We can see in the image below that the average P/E (8.5) for companies in the consumer finance industry is higher than Qudian's P/E.
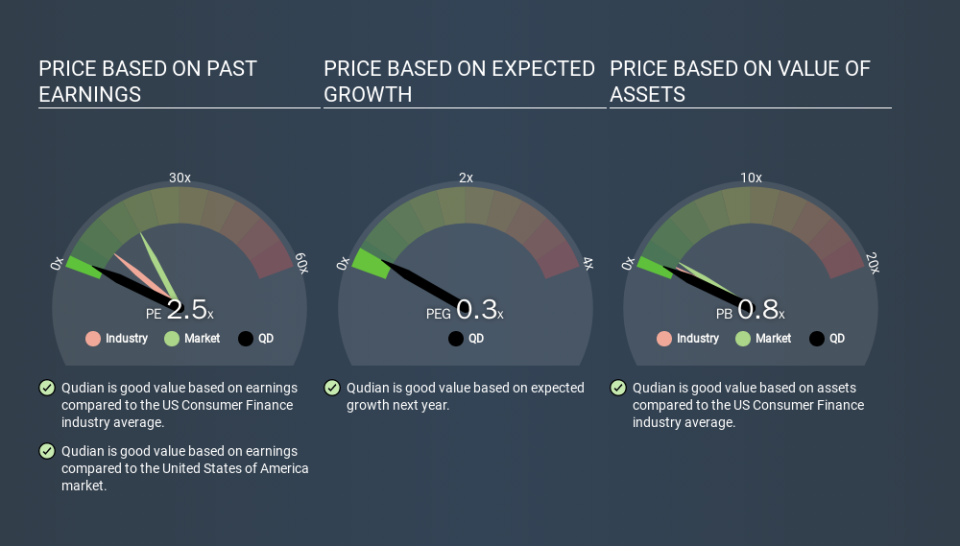
This suggests that market participants think Qudian will underperform other companies in its industry. Since the market seems unimpressed with Qudian, it's quite possible it could surprise on the upside. If you consider the stock interesting, further research is recommended. For example, I often monitor director buying and selling.
How Growth Rates Impact P/E Ratios
Generally speaking the rate of earnings growth has a profound impact on a company's P/E multiple. Earnings growth means that in the future the 'E' will be higher. That means even if the current P/E is high, it will reduce over time if the share price stays flat. And as that P/E ratio drops, the company will look cheap, unless its share price increases.
Qudian's 86% EPS improvement over the last year was like bamboo growth after rain; rapid and impressive. Even better, EPS is up 83% per year over three years. So you might say it really deserves to have an above-average P/E ratio.
Remember: P/E Ratios Don't Consider The Balance Sheet
One drawback of using a P/E ratio is that it considers market capitalization, but not the balance sheet. In other words, it does not consider any debt or cash that the company may have on the balance sheet. Theoretically, a business can improve its earnings (and produce a lower P/E in the future) by investing in growth. That means taking on debt (or spending its cash).
While growth expenditure doesn't always pay off, the point is that it is a good option to have; but one that the P/E ratio ignores.
Qudian's Balance Sheet
Qudian has net debt worth just 8.0% of its market capitalization. The market might award it a higher P/E ratio if it had net cash, but its unlikely this low level of net borrowing is having a big impact on the P/E multiple.
The Verdict On Qudian's P/E Ratio
Qudian's P/E is 2.5 which is below average (18.3) in the US market. The company hasn't stretched its balance sheet, and earnings growth was good last year. If the company can continue to grow earnings, then the current P/E may be unjustifiably low. Because analysts are predicting more growth in the future, one might have expected to see a higher P/E ratio. You can take a closer look at the fundamentals, here. What can be absolutely certain is that the market has become more pessimistic about Qudian over the last month, with the P/E ratio falling from 3.6 back then to 2.5 today. For those who prefer to invest with the flow of momentum, that might be a bad sign, but for deep value investors this stock might justify some research.
When the market is wrong about a stock, it gives savvy investors an opportunity. As value investor Benjamin Graham famously said, 'In the short run, the market is a voting machine but in the long run, it is a weighing machine. So this free visual report on analyst forecasts could hold the key to an excellent investment decision.
Of course you might be able to find a better stock than Qudian. So you may wish to see this free collection of other companies that have grown earnings strongly.
If you spot an error that warrants correction, please contact the editor at editorial-team@simplywallst.com. This article by Simply Wall St is general in nature. It does not constitute a recommendation to buy or sell any stock, and does not take account of your objectives, or your financial situation. Simply Wall St has no position in the stocks mentioned.
We aim to bring you long-term focused research analysis driven by fundamental data. Note that our analysis may not factor in the latest price-sensitive company announcements or qualitative material. Thank you for reading.
