
 Yahoo Finance
 Does PerkinElmer, Inc.'s (NYSE:PKI) CEO Pay Compare Well With Peers?

Want to participate in a short research study? Help shape the future of investing tools and you could win a $250 gift card!
Rob Friel has been the CEO of PerkinElmer, Inc. (NYSE:PKI) since 2008. This analysis aims first to contrast CEO compensation with other large companies. Next, we'll consider growth that the business demonstrates. And finally we will reflect on how common stockholders have fared in the last few years, as a secondary measure of performance. This process should give us an idea about how appropriately the CEO is paid.
See our latest analysis for PerkinElmer
How Does Rob Friel's Compensation Compare With Similar Sized Companies?
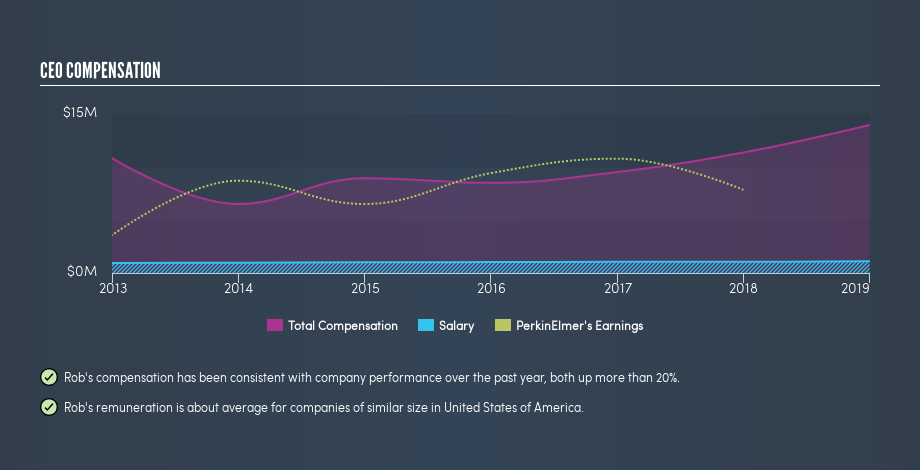
At the time of writing our data says that PerkinElmer, Inc. has a market cap of US$11b, and is paying total annual CEO compensation of US$14m. (This figure is for the year to December 2018). While this analysis focuses on total compensation, it's worth noting the salary is lower, valued at US$1.1m. When we examined a group of companies with market caps over US$8.0b, we found that their median CEO total compensation was US$11m. (We took a wide range because the CEOs of massive companies tend to be paid similar amounts - even though some are quite a bit bigger than others).
So Rob Friel is paid around the average of the companies we looked at. While this data point isn't particularly informative alone, it gains more meaning when considered with business performance.
You can see, below, how CEO compensation at PerkinElmer has changed over time.
Is PerkinElmer, Inc. Growing?
PerkinElmer, Inc. has reduced its earnings per share by an average of 1.5% a year, over the last three years (measured with a line of best fit). It achieved revenue growth of 17% over the last year.
Unfortunately there is a complete lack of earnings per share improvement, over three years. And while it's good to see some good revenue growth recently, the growth isn't really fast enough for me to put aside my concerns around earnings. It's hard to argue the company is firing on all cylinders, so shareholders might be averse to high CEO remuneration. It could be important to check this free visual depiction of what analysts expect for the future.
Has PerkinElmer, Inc. Been A Good Investment?
Most shareholders would probably be pleased with PerkinElmer, Inc. for providing a total return of 88% over three years. So they may not be at all concerned if the CEO were to be paid more than is normal for companies around the same size.
In Summary...
Remuneration for Rob Friel is close enough to the median pay for a CEO of a large company .
We feel that earnings per share have been a bit disappointing, but it's nice to see positive shareholder returns over the last three years. So we can't see a reason to suggest the pay is inappropriate. CEO compensation is one thing, but it is also interesting to check if the CEO is buying or selling PerkinElmer (free visualization of insider trades).
Of course, you might find a fantastic investment by looking elsewhere. So take a peek at this free list of interesting companies.
We aim to bring you long-term focused research analysis driven by fundamental data. Note that our analysis may not factor in the latest price-sensitive company announcements or qualitative material.
If you spot an error that warrants correction, please contact the editor at editorial-team@simplywallst.com. This article by Simply Wall St is general in nature. It does not constitute a recommendation to buy or sell any stock, and does not take account of your objectives, or your financial situation. Simply Wall St has no position in the stocks mentioned. Thank you for reading.
