
 Yahoo Finance
 Does Oil-Dri Corporation of America's (NYSE:ODC) Share Price Gain of 19% Match Its Business Performance?

If you buy and hold a stock for many years, you'd hope to be making a profit. Better yet, you'd like to see the share price move up more than the market average. But Oil-Dri Corporation of America (NYSE:ODC) has fallen short of that second goal, with a share price rise of 19% over five years, which is below the market return. Looking at the last year alone, the stock is up 8.8%.
View our latest analysis for Oil-Dri Corporation of America
In his essay The Superinvestors of Graham-and-Doddsville Warren Buffett described how share prices do not always rationally reflect the value of a business. One flawed but reasonable way to assess how sentiment around a company has changed is to compare the earnings per share (EPS) with the share price.
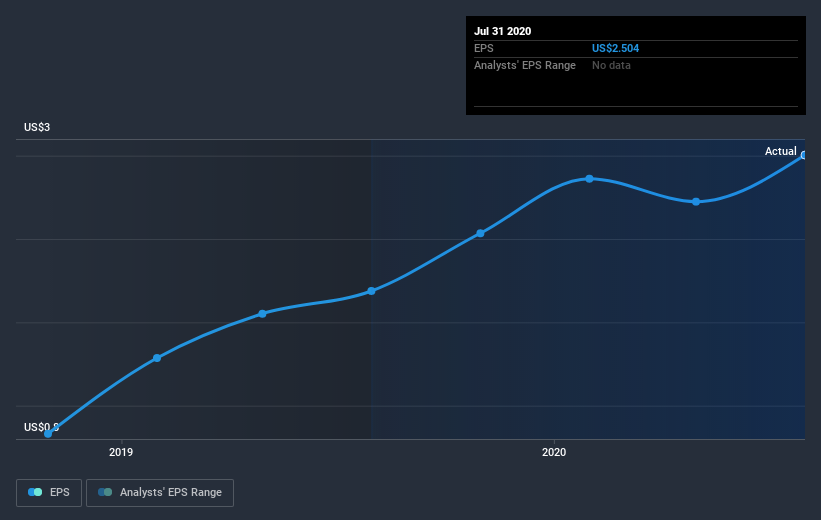
Over half a decade, Oil-Dri Corporation of America managed to grow its earnings per share at 9.2% a year. The EPS growth is more impressive than the yearly share price gain of 4% over the same period. So it seems the market isn't so enthusiastic about the stock these days.
The company's earnings per share (over time) is depicted in the image below (click to see the exact numbers).
We consider it positive that insiders have made significant purchases in the last year. Having said that, most people consider earnings and revenue growth trends to be a more meaningful guide to the business. Before buying or selling a stock, we always recommend a close examination of historic growth trends, available here..
What About Dividends?
When looking at investment returns, it is important to consider the difference between total shareholder return (TSR) and share price return. The TSR incorporates the value of any spin-offs or discounted capital raisings, along with any dividends, based on the assumption that the dividends are reinvested. Arguably, the TSR gives a more comprehensive picture of the return generated by a stock. As it happens, Oil-Dri Corporation of America's TSR for the last 5 years was 36%, which exceeds the share price return mentioned earlier. The dividends paid by the company have thusly boosted the total shareholder return.
A Different Perspective
Oil-Dri Corporation of America shareholders gained a total return of 12% during the year. But that return falls short of the market. On the bright side, that's still a gain, and it's actually better than the average return of 6% over half a decade This could indicate that the company is winning over new investors, as it pursues its strategy. It's always interesting to track share price performance over the longer term. But to understand Oil-Dri Corporation of America better, we need to consider many other factors. For instance, we've identified 1 warning sign for Oil-Dri Corporation of America that you should be aware of.
Oil-Dri Corporation of America is not the only stock insiders are buying. So take a peek at this free list of growing companies with insider buying.
Please note, the market returns quoted in this article reflect the market weighted average returns of stocks that currently trade on US exchanges.
This article by Simply Wall St is general in nature. It does not constitute a recommendation to buy or sell any stock, and does not take account of your objectives, or your financial situation. We aim to bring you long-term focused analysis driven by fundamental data. Note that our analysis may not factor in the latest price-sensitive company announcements or qualitative material. Simply Wall St has no position in any stocks mentioned.
Have feedback on this article? Concerned about the content? Get in touch with us directly. Alternatively, email editorial-team@simplywallst.com.
