
 Yahoo Finance
 What Does Noni B Limited's (ASX:NBL) P/E Ratio Tell You?

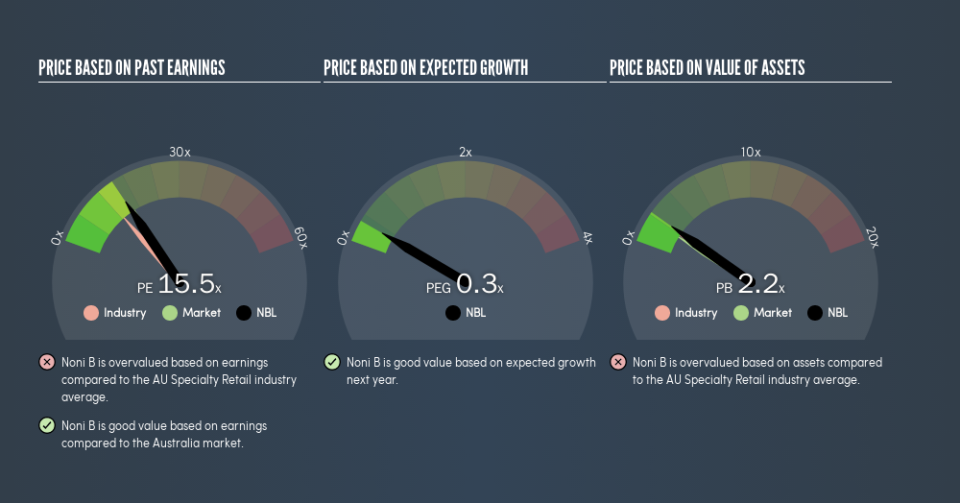
This article is for investors who would like to improve their understanding of price to earnings ratios (P/E ratios). To keep it practical, we'll show how Noni B Limited's (ASX:NBL) P/E ratio could help you assess the value on offer. Looking at earnings over the last twelve months, Noni B has a P/E ratio of 15.52. That is equivalent to an earnings yield of about 6.4%.
View our latest analysis for Noni B
How Do You Calculate A P/E Ratio?
The formula for P/E is:
Price to Earnings Ratio = Price per Share ÷ Earnings per Share (EPS)
Or for Noni B:
P/E of 15.52 = A$2.6 ÷ A$0.17 (Based on the year to December 2018.)
Is A High Price-to-Earnings Ratio Good?
A higher P/E ratio implies that investors pay a higher price for the earning power of the business. All else being equal, it's better to pay a low price -- but as Warren Buffett said, 'It's far better to buy a wonderful company at a fair price than a fair company at a wonderful price.'
How Does Noni B's P/E Ratio Compare To Its Peers?
The P/E ratio indicates whether the market has higher or lower expectations of a company. The image below shows that Noni B has a higher P/E than the average (12.5) P/E for companies in the specialty retail industry.
Its relatively high P/E ratio indicates that Noni B shareholders think it will perform better than other companies in its industry classification. Clearly the market expects growth, but it isn't guaranteed. So further research is always essential. I often monitor director buying and selling.
How Growth Rates Impact P/E Ratios
Probably the most important factor in determining what P/E a company trades on is the earnings growth. Earnings growth means that in the future the 'E' will be higher. That means even if the current P/E is high, it will reduce over time if the share price stays flat. Then, a lower P/E should attract more buyers, pushing the share price up.
Noni B increased earnings per share by 6.9% last year. And it has improved its earnings per share by 151% per year over the last three years.
Don't Forget: The P/E Does Not Account For Debt or Bank Deposits
One drawback of using a P/E ratio is that it considers market capitalization, but not the balance sheet. In other words, it does not consider any debt or cash that the company may have on the balance sheet. In theory, a company can lower its future P/E ratio by using cash or debt to invest in growth.
While growth expenditure doesn't always pay off, the point is that it is a good option to have; but one that the P/E ratio ignores.
How Does Noni B's Debt Impact Its P/E Ratio?
With net cash of AU$43m, Noni B has a very strong balance sheet, which may be important for its business. Having said that, at 17% of its market capitalization the cash hoard would contribute towards a higher P/E ratio.
The Bottom Line On Noni B's P/E Ratio
Noni B trades on a P/E ratio of 15.5, which is fairly close to the AU market average of 16.2. EPS was up modestly better over the last twelve months. And the net cash position gives the company many options. The average P/E suggests the market isn't overly optimistic, though.
Investors should be looking to buy stocks that the market is wrong about. If it is underestimating a company, investors can make money by buying and holding the shares until the market corrects itself. So this free visualization of the analyst consensus on future earnings could help you make the right decision about whether to buy, sell, or hold.
Of course, you might find a fantastic investment by looking at a few good candidates. So take a peek at this free list of companies with modest (or no) debt, trading on a P/E below 20.
We aim to bring you long-term focused research analysis driven by fundamental data. Note that our analysis may not factor in the latest price-sensitive company announcements or qualitative material.
If you spot an error that warrants correction, please contact the editor at editorial-team@simplywallst.com. This article by Simply Wall St is general in nature. It does not constitute a recommendation to buy or sell any stock, and does not take account of your objectives, or your financial situation. Simply Wall St has no position in the stocks mentioned. Thank you for reading.
