
 Yahoo Finance
 Does Newell Brands (NASDAQ:NWL) Have A Healthy Balance Sheet?

Legendary fund manager Li Lu (who Charlie Munger backed) once said, 'The biggest investment risk is not the volatility of prices, but whether you will suffer a permanent loss of capital. When we think about how risky a company is, we always like to look at its use of debt, since debt overload can lead to ruin. Importantly, Newell Brands Inc. (NASDAQ:NWL) does carry debt. But the real question is whether this debt is making the company risky.
What Risk Does Debt Bring?
Debt and other liabilities become risky for a business when it cannot easily fulfill those obligations, either with free cash flow or by raising capital at an attractive price. In the worst case scenario, a company can go bankrupt if it cannot pay its creditors. However, a more frequent (but still costly) occurrence is where a company must issue shares at bargain-basement prices, permanently diluting shareholders, just to shore up its balance sheet. By replacing dilution, though, debt can be an extremely good tool for businesses that need capital to invest in growth at high rates of return. The first thing to do when considering how much debt a business uses is to look at its cash and debt together.
View our latest analysis for Newell Brands
What Is Newell Brands's Net Debt?
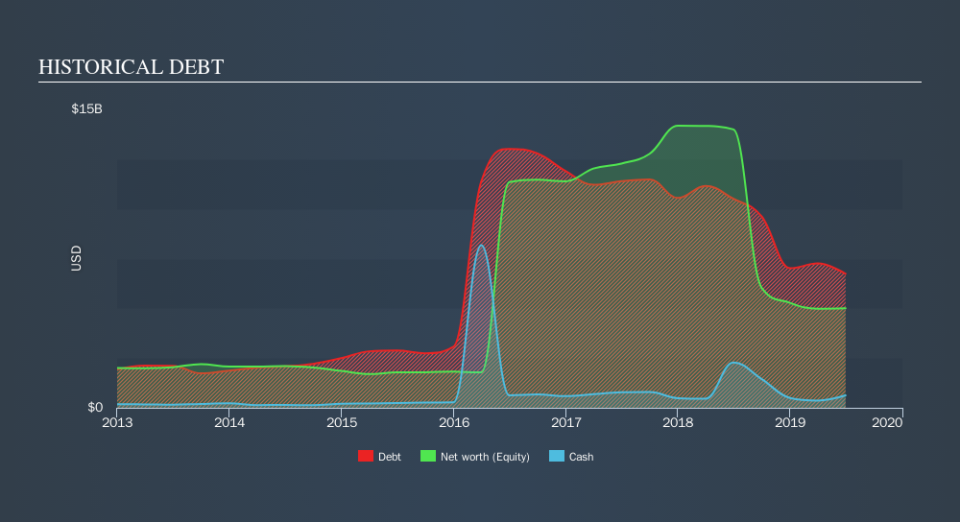
You can click the graphic below for the historical numbers, but it shows that Newell Brands had US$6.74b of debt in June 2019, down from US$10.5b, one year before. On the flip side, it has US$624.5m in cash leading to net debt of about US$6.11b.
How Healthy Is Newell Brands's Balance Sheet?
The latest balance sheet data shows that Newell Brands had liabilities of US$3.14b due within a year, and liabilities of US$9.53b falling due after that. Offsetting these obligations, it had cash of US$624.5m as well as receivables valued at US$1.77b due within 12 months. So it has liabilities totalling US$10.3b more than its cash and near-term receivables, combined.
Given this deficit is actually higher than the company's market capitalization of US$8.25b, we think shareholders really should watch Newell Brands's debt levels, like a parent watching their child ride a bike for the first time. In the scenario where the company had to clean up its balance sheet quickly, it seems likely shareholders would suffer extensive dilution.
We measure a company's debt load relative to its earnings power by looking at its net debt divided by its earnings before interest, tax, depreciation, and amortization (EBITDA) and by calculating how easily its earnings before interest and tax (EBIT) cover its interest expense (interest cover). The advantage of this approach is that we take into account both the absolute quantum of debt (with net debt to EBITDA) and the actual interest expenses associated with that debt (with its interest cover ratio).
Newell Brands shareholders face the double whammy of a high net debt to EBITDA ratio (6.2), and fairly weak interest coverage, since EBIT is just 1.7 times the interest expense. This means we'd consider it to have a heavy debt load. The good news is that Newell Brands grew its EBIT a smooth 37% over the last twelve months. Like a mother's loving embrace of a newborn that sort of growth builds resilience, putting the company in a stronger position to manage its debt. There's no doubt that we learn most about debt from the balance sheet. But ultimately the future profitability of the business will decide if Newell Brands can strengthen its balance sheet over time. So if you're focused on the future you can check out this free report showing analyst profit forecasts.
Finally, a business needs free cash flow to pay off debt; accounting profits just don't cut it. So we always check how much of that EBIT is translated into free cash flow. Over the most recent three years, Newell Brands recorded free cash flow worth 74% of its EBIT, which is around normal, given free cash flow excludes interest and tax. This cold hard cash means it can reduce its debt when it wants to.
Our View
We feel some trepidation about Newell Brands's difficulty net debt to EBITDA, but we've got positives to focus on, too. For example, its EBIT growth rate and conversion of EBIT to free cash flow give us some confidence in its ability to manage its debt. When we consider all the factors discussed, it seems to us that Newell Brands is taking some risks with its use of debt. While that debt can boost returns, we think the company has enough leverage now. In light of our reservations about the company's balance sheet, it seems sensible to check if insiders have been selling shares recently.
If you're interested in investing in businesses that can grow profits without the burden of debt, then check out this free list of growing businesses that have net cash on the balance sheet.
We aim to bring you long-term focused research analysis driven by fundamental data. Note that our analysis may not factor in the latest price-sensitive company announcements or qualitative material.
If you spot an error that warrants correction, please contact the editor at editorial-team@simplywallst.com. This article by Simply Wall St is general in nature. It does not constitute a recommendation to buy or sell any stock, and does not take account of your objectives, or your financial situation. Simply Wall St has no position in the stocks mentioned. Thank you for reading.
