
 Yahoo Finance
 How Does National Beverage's (NASDAQ:FIZZ) P/E Compare To Its Industry, After Its Big Share Price Gain?

The National Beverage (NASDAQ:FIZZ) share price has done well in the last month, posting a gain of 35%. But shareholders may not all be feeling jubilant, since the share price is still down 35% in the last year.
Assuming no other changes, a sharply higher share price makes a stock less attractive to potential buyers. In the long term, share prices tend to follow earnings per share, but in the short term prices bounce around in response to short term factors (which are not always obvious). The implication here is that deep value investors might steer clear when expectations of a company are too high. One way to gauge market expectations of a stock is to look at its Price to Earnings Ratio (PE Ratio). A high P/E implies that investors have high expectations of what a company can achieve compared to a company with a low P/E ratio.
Check out our latest analysis for National Beverage
Does National Beverage Have A Relatively High Or Low P/E For Its Industry?
National Beverage's P/E of 19.92 indicates relatively low sentiment towards the stock. We can see in the image below that the average P/E (29.5) for companies in the beverage industry is higher than National Beverage's P/E.
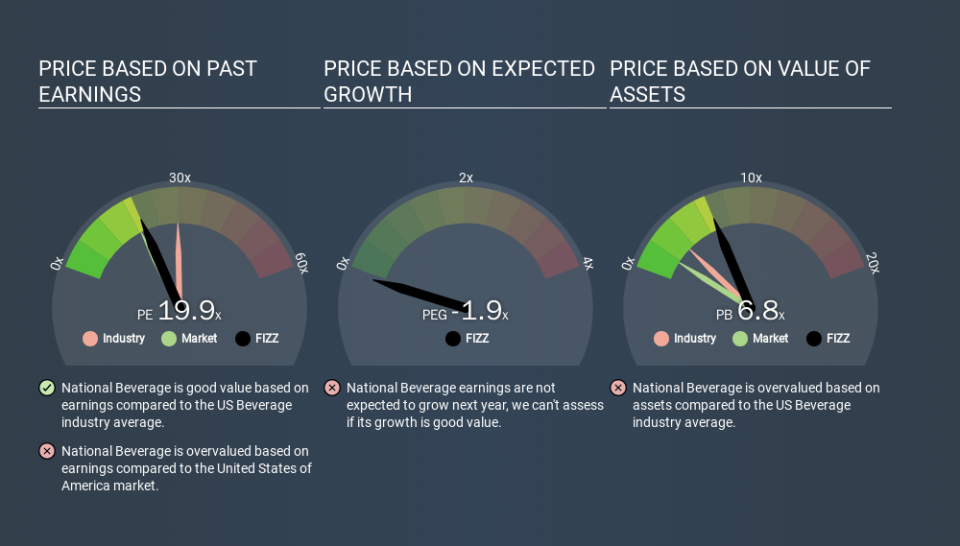
This suggests that market participants think National Beverage will underperform other companies in its industry. Many investors like to buy stocks when the market is pessimistic about their prospects. It is arguably worth checking if insiders are buying shares, because that might imply they believe the stock is undervalued.
How Growth Rates Impact P/E Ratios
Probably the most important factor in determining what P/E a company trades on is the earnings growth. If earnings are growing quickly, then the 'E' in the equation will increase faster than it would otherwise. That means unless the share price increases, the P/E will reduce in a few years. Then, a lower P/E should attract more buyers, pushing the share price up.
National Beverage shrunk earnings per share by 21% over the last year. But over the longer term (5 years) earnings per share have increased by 22%.
Don't Forget: The P/E Does Not Account For Debt or Bank Deposits
The 'Price' in P/E reflects the market capitalization of the company. So it won't reflect the advantage of cash, or disadvantage of debt. The exact same company would hypothetically deserve a higher P/E ratio if it had a strong balance sheet, than if it had a weak one with lots of debt, because a cashed up company can spend on growth.
Such expenditure might be good or bad, in the long term, but the point here is that the balance sheet is not reflected by this ratio.
How Does National Beverage's Debt Impact Its P/E Ratio?
Since National Beverage holds net cash of US$203m, it can spend on growth, justifying a higher P/E ratio than otherwise.
The Verdict On National Beverage's P/E Ratio
National Beverage has a P/E of 19.9. That's higher than the average in its market, which is 18.5. The recent drop in earnings per share would make some investors cautious, but the healthy balance sheet means the company retains potential for future growth. If fails to eventuate, the current high P/E could prove to be temporary, as the share price falls. What is very clear is that the market has become significantly more optimistic about National Beverage over the last month, with the P/E ratio rising from 14.8 back then to 19.9 today. If you like to buy stocks that have recently impressed the market, then this one might be a candidate; but if you prefer to invest when there is 'blood in the streets', then you may feel the opportunity has passed.
Investors have an opportunity when market expectations about a stock are wrong. If the reality for a company is better than it expects, you can make money by buying and holding for the long term. So this free visual report on analyst forecasts could hold the key to an excellent investment decision.
Of course, you might find a fantastic investment by looking at a few good candidates. So take a peek at this free list of companies with modest (or no) debt, trading on a P/E below 20.
If you spot an error that warrants correction, please contact the editor at editorial-team@simplywallst.com. This article by Simply Wall St is general in nature. It does not constitute a recommendation to buy or sell any stock, and does not take account of your objectives, or your financial situation. Simply Wall St has no position in the stocks mentioned.
We aim to bring you long-term focused research analysis driven by fundamental data. Note that our analysis may not factor in the latest price-sensitive company announcements or qualitative material. Thank you for reading.
