
 Yahoo Finance
 What Does MNF Group Limited’s (ASX:MNF) 10% ROCE Say About The Business?

Today we'll evaluate MNF Group Limited (ASX:MNF) to determine whether it could have potential as an investment idea. In particular, we'll consider its Return On Capital Employed (ROCE), as that can give us insight into how profitably the company is able to employ capital in its business.
First of all, we'll work out how to calculate ROCE. Then we'll compare its ROCE to similar companies. Last but not least, we'll look at what impact its current liabilities have on its ROCE.
Understanding Return On Capital Employed (ROCE)
ROCE is a measure of a company's yearly pre-tax profit (its return), relative to the capital employed in the business. All else being equal, a better business will have a higher ROCE. In brief, it is a useful tool, but it is not without drawbacks. Author Edwin Whiting says to be careful when comparing the ROCE of different businesses, since 'No two businesses are exactly alike.'
So, How Do We Calculate ROCE?
Analysts use this formula to calculate return on capital employed:
Return on Capital Employed = Earnings Before Interest and Tax (EBIT) ÷ (Total Assets - Current Liabilities)
Or for MNF Group:
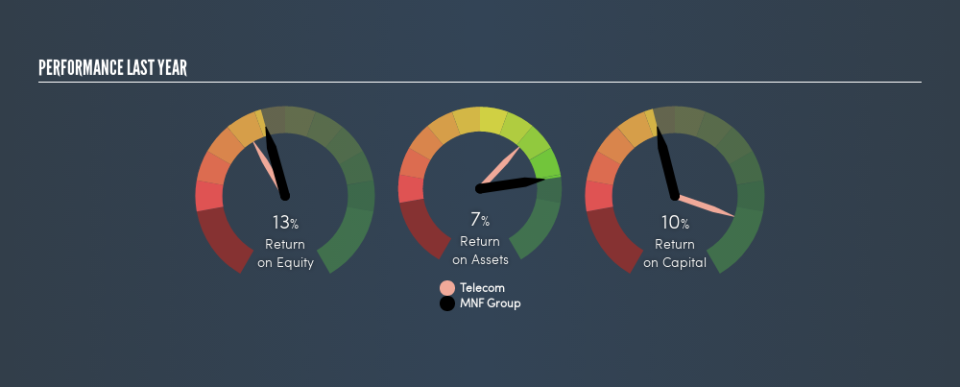
0.10 = AU$15m ÷ (AU$183m - AU$37m) (Based on the trailing twelve months to June 2019.)
Therefore, MNF Group has an ROCE of 10%.
See our latest analysis for MNF Group
Is MNF Group's ROCE Good?
ROCE is commonly used for comparing the performance of similar businesses. Using our data, MNF Group's ROCE appears to be around the 9.7% average of the Telecom industry. Aside from the industry comparison, MNF Group's ROCE is mediocre in absolute terms, considering the risk of investing in stocks versus the safety of a bank account. Readers may find more attractive investment prospects elsewhere.
We can see that , MNF Group currently has an ROCE of 10%, less than the 25% it reported 3 years ago. This makes us wonder if the business is facing new challenges. The image below shows how MNF Group's ROCE compares to its industry, and you can click it to see more detail on its past growth.
Remember that this metric is backwards looking - it shows what has happened in the past, and does not accurately predict the future. ROCE can be misleading for companies in cyclical industries, with returns looking impressive during the boom times, but very weak during the busts. ROCE is only a point-in-time measure. What happens in the future is pretty important for investors, so we have prepared a free report on analyst forecasts for MNF Group.
Do MNF Group's Current Liabilities Skew Its ROCE?
Current liabilities are short term bills and invoices that need to be paid in 12 months or less. The ROCE equation subtracts current liabilities from capital employed, so a company with a lot of current liabilities appears to have less capital employed, and a higher ROCE than otherwise. To check the impact of this, we calculate if a company has high current liabilities relative to its total assets.
MNF Group has total liabilities of AU$37m and total assets of AU$183m. As a result, its current liabilities are equal to approximately 21% of its total assets. It is good to see a restrained amount of current liabilities, as this limits the effect on ROCE.
Our Take On MNF Group's ROCE
That said, MNF Group's ROCE is mediocre, there may be more attractive investments around. But note: make sure you look for a great company, not just the first idea you come across. So take a peek at this free list of interesting companies with strong recent earnings growth (and a P/E ratio below 20).
I will like MNF Group better if I see some big insider buys. While we wait, check out this free list of growing companies with considerable, recent, insider buying.
We aim to bring you long-term focused research analysis driven by fundamental data. Note that our analysis may not factor in the latest price-sensitive company announcements or qualitative material.
If you spot an error that warrants correction, please contact the editor at editorial-team@simplywallst.com. This article by Simply Wall St is general in nature. It does not constitute a recommendation to buy or sell any stock, and does not take account of your objectives, or your financial situation. Simply Wall St has no position in the stocks mentioned. Thank you for reading.
