
 Yahoo Finance
 How Does Image Resources's (ASX:IMA) P/E Compare To Its Industry, After The Share Price Drop?

Unfortunately for some shareholders, the Image Resources (ASX:IMA) share price has dived 30% in the last thirty days. The recent drop has obliterated the annual return, with the share price now down 14% over that longer period.
All else being equal, a share price drop should make a stock more attractive to potential investors. In the long term, share prices tend to follow earnings per share, but in the short term prices bounce around in response to short term factors (which are not always obvious). The implication here is that long term investors have an opportunity when expectations of a company are too low. One way to gauge market expectations of a stock is to look at its Price to Earnings Ratio (PE Ratio). Investors have optimistic expectations of companies with higher P/E ratios, compared to companies with lower P/E ratios.
See our latest analysis for Image Resources
How Does Image Resources's P/E Ratio Compare To Its Peers?
We can tell from its P/E ratio of 7.00 that sentiment around Image Resources isn't particularly high. If you look at the image below, you can see Image Resources has a lower P/E than the average (8.2) in the metals and mining industry classification.
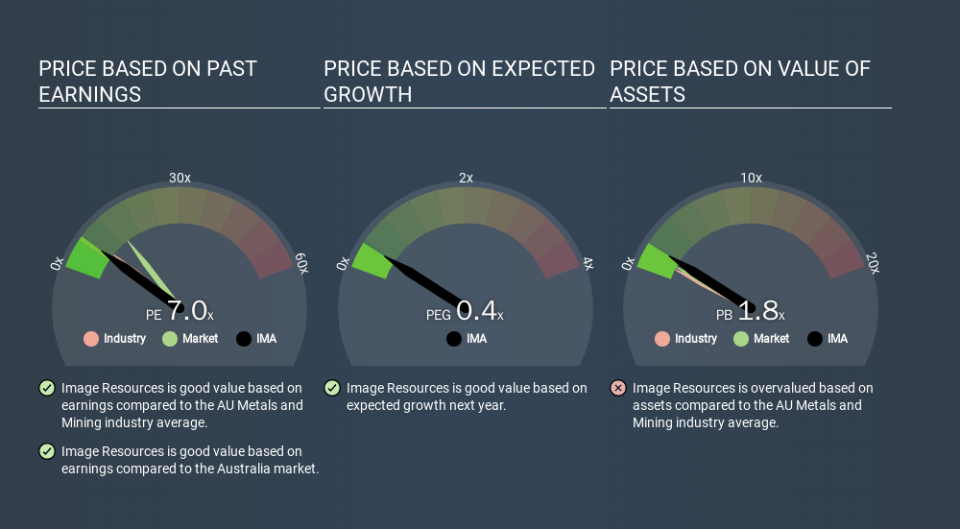
Its relatively low P/E ratio indicates that Image Resources shareholders think it will struggle to do as well as other companies in its industry classification. Since the market seems unimpressed with Image Resources, it's quite possible it could surprise on the upside. It is arguably worth checking if insiders are buying shares, because that might imply they believe the stock is undervalued.
How Growth Rates Impact P/E Ratios
P/E ratios primarily reflect market expectations around earnings growth rates. If earnings are growing quickly, then the 'E' in the equation will increase faster than it would otherwise. That means even if the current P/E is high, it will reduce over time if the share price stays flat. And as that P/E ratio drops, the company will look cheap, unless its share price increases.
In the last year, Image Resources grew EPS like Taylor Swift grew her fan base back in 2010; the 456% gain was both fast and well deserved.
Remember: P/E Ratios Don't Consider The Balance Sheet
It's important to note that the P/E ratio considers the market capitalization, not the enterprise value. In other words, it does not consider any debt or cash that the company may have on the balance sheet. The exact same company would hypothetically deserve a higher P/E ratio if it had a strong balance sheet, than if it had a weak one with lots of debt, because a cashed up company can spend on growth.
Such expenditure might be good or bad, in the long term, but the point here is that the balance sheet is not reflected by this ratio.
So What Does Image Resources's Balance Sheet Tell Us?
Image Resources has net debt worth just 4.1% of its market capitalization. The market might award it a higher P/E ratio if it had net cash, but its unlikely this low level of net borrowing is having a big impact on the P/E multiple.
The Verdict On Image Resources's P/E Ratio
Image Resources trades on a P/E ratio of 7.0, which is below the AU market average of 13.9. The EPS growth last year was strong, and debt levels are quite reasonable. The low P/E ratio suggests current market expectations are muted, implying these levels of growth will not continue. Since analysts are predicting growth will continue, one might expect to see a higher P/E so it may be worth looking closer. Given Image Resources's P/E ratio has declined from 10.0 to 7.0 in the last month, we know for sure that the market is more worried about the business today, than it was back then. For those who prefer to invest with the flow of momentum, that might be a bad sign, but for deep value investors this stock might justify some research.
Investors should be looking to buy stocks that the market is wrong about. If the reality for a company is not as bad as the P/E ratio indicates, then the share price should increase as the market realizes this. So this free report on the analyst consensus forecasts could help you make a master move on this stock.
Of course you might be able to find a better stock than Image Resources. So you may wish to see this free collection of other companies that have grown earnings strongly.
If you spot an error that warrants correction, please contact the editor at editorial-team@simplywallst.com. This article by Simply Wall St is general in nature. It does not constitute a recommendation to buy or sell any stock, and does not take account of your objectives, or your financial situation. Simply Wall St has no position in the stocks mentioned.
We aim to bring you long-term focused research analysis driven by fundamental data. Note that our analysis may not factor in the latest price-sensitive company announcements or qualitative material. Thank you for reading.
