
 Yahoo Finance
 Does Hollysys Automation Technologies Ltd.'s (NASDAQ:HOLI) P/E Ratio Signal A Buying Opportunity?

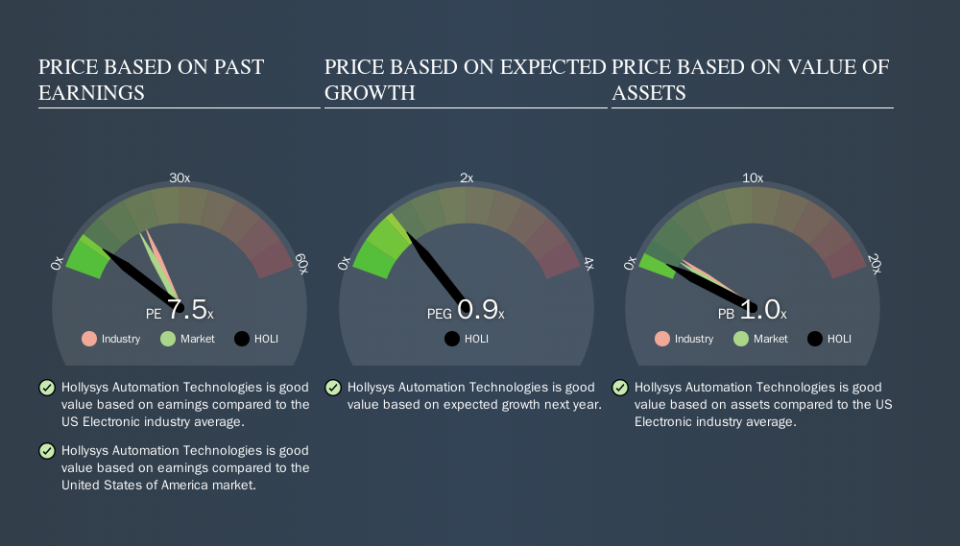
This article is written for those who want to get better at using price to earnings ratios (P/E ratios). We'll look at Hollysys Automation Technologies Ltd.'s (NASDAQ:HOLI) P/E ratio and reflect on what it tells us about the company's share price. Hollysys Automation Technologies has a price to earnings ratio of 7.54, based on the last twelve months. That means that at current prices, buyers pay $7.54 for every $1 in trailing yearly profits.
See our latest analysis for Hollysys Automation Technologies
How Do I Calculate A Price To Earnings Ratio?
The formula for P/E is:
Price to Earnings Ratio = Price per Share ÷ Earnings per Share (EPS)
Or for Hollysys Automation Technologies:
P/E of 7.54 = $15.62 ÷ $2.07 (Based on the year to June 2019.)
Is A High P/E Ratio Good?
The higher the P/E ratio, the higher the price tag of a business, relative to its trailing earnings. That is not a good or a bad thing per se, but a high P/E does imply buyers are optimistic about the future.
Does Hollysys Automation Technologies Have A Relatively High Or Low P/E For Its Industry?
One good way to get a quick read on what market participants expect of a company is to look at its P/E ratio. The image below shows that Hollysys Automation Technologies has a lower P/E than the average (20.7) P/E for companies in the electronic industry.
Hollysys Automation Technologies's P/E tells us that market participants think it will not fare as well as its peers in the same industry. While current expectations are low, the stock could be undervalued if the situation is better than the market assumes. If you consider the stock interesting, further research is recommended. For example, I often monitor director buying and selling.
How Growth Rates Impact P/E Ratios
Generally speaking the rate of earnings growth has a profound impact on a company's P/E multiple. When earnings grow, the 'E' increases, over time. Therefore, even if you pay a high multiple of earnings now, that multiple will become lower in the future. So while a stock may look expensive based on past earnings, it could be cheap based on future earnings.
Most would be impressed by Hollysys Automation Technologies earnings growth of 17% in the last year. And earnings per share have improved by 12% annually, over the last five years. With that performance, you might expect an above average P/E ratio.
A Limitation: P/E Ratios Ignore Debt and Cash In The Bank
Don't forget that the P/E ratio considers market capitalization. So it won't reflect the advantage of cash, or disadvantage of debt. The exact same company would hypothetically deserve a higher P/E ratio if it had a strong balance sheet, than if it had a weak one with lots of debt, because a cashed up company can spend on growth.
Such spending might be good or bad, overall, but the key point here is that you need to look at debt to understand the P/E ratio in context.
How Does Hollysys Automation Technologies's Debt Impact Its P/E Ratio?
Hollysys Automation Technologies has net cash of US$454m. This is fairly high at 48% of its market capitalization. That might mean balance sheet strength is important to the business, but should also help push the P/E a bit higher than it would otherwise be.
The Verdict On Hollysys Automation Technologies's P/E Ratio
Hollysys Automation Technologies's P/E is 7.5 which is below average (18.2) in the US market. Not only should the net cash position reduce risk, but the recent growth has been impressive. The relatively low P/E ratio implies the market is pessimistic. Since analysts are predicting growth will continue, one might expect to see a higher P/E so it may be worth looking closer
When the market is wrong about a stock, it gives savvy investors an opportunity. If the reality for a company is not as bad as the P/E ratio indicates, then the share price should increase as the market realizes this. So this free visual report on analyst forecasts could hold the key to an excellent investment decision.
Of course you might be able to find a better stock than Hollysys Automation Technologies. So you may wish to see this free collection of other companies that have grown earnings strongly.
We aim to bring you long-term focused research analysis driven by fundamental data. Note that our analysis may not factor in the latest price-sensitive company announcements or qualitative material.
If you spot an error that warrants correction, please contact the editor at editorial-team@simplywallst.com. This article by Simply Wall St is general in nature. It does not constitute a recommendation to buy or sell any stock, and does not take account of your objectives, or your financial situation. Simply Wall St has no position in the stocks mentioned. Thank you for reading.
