
 Yahoo Finance
 Does Hillenbrand, Inc.'s (NYSE:HI) CEO Pay Matter?
Want to participate in a short research study? Help shape the future of investing tools and you could win a $250 gift card!
In 2013 Joe Raver was appointed CEO of Hillenbrand, Inc. (NYSE:HI). This report will, first, examine the CEO compensation levels in comparison to CEO compensation at companies of similar size. Next, we'll consider growth that the business demonstrates. Third, we'll reflect on the total return to shareholders over three years, as a second measure of business performance. This method should give us information to assess how appropriately the company pays the CEO.
Check out our latest analysis for Hillenbrand
How Does Joe Raver's Compensation Compare With Similar Sized Companies?
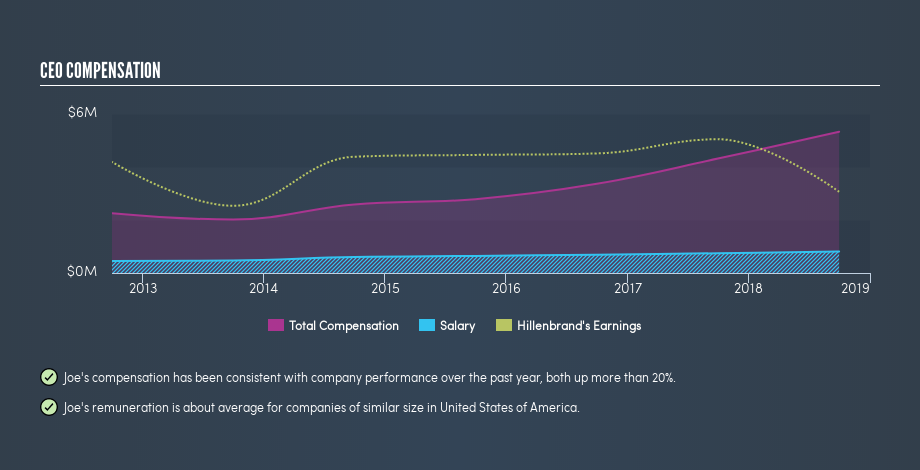
Our data indicates that Hillenbrand, Inc. is worth US$2.5b, and total annual CEO compensation is US$5.3m. (This number is for the twelve months until September 2018). While this analysis focuses on total compensation, it's worth noting the salary is lower, valued at US$810k. We looked at a group of companies with market capitalizations from US$2.0b to US$6.4b, and the median CEO total compensation was US$5.2m.
So Joe Raver receives a similar amount to the median CEO pay, amongst the companies we looked at. This doesn't tell us a whole lot on its own, but looking at the performance of the actual business will give us useful context.
The graphic below shows how CEO compensation at Hillenbrand has changed from year to year.
Is Hillenbrand, Inc. Growing?
Over the last three years Hillenbrand, Inc. has shrunk its earnings per share by an average of 2.6% per year (measured with a line of best fit). Its revenue is up 6.4% over last year.
The lack of earnings per share growth in the last three years is unimpressive. The modest increase in revenue in the last year isn't enough to make me overlook the disappointing change in earnings per share. It's hard to argue the company is firing on all cylinders, so shareholders might be averse to high CEO remuneration. It could be important to check this free visual depiction of what analysts expect for the future.
Has Hillenbrand, Inc. Been A Good Investment?
Most shareholders would probably be pleased with Hillenbrand, Inc. for providing a total return of 40% over three years. This strong performance might mean some shareholders don't mind if the CEO were to be paid more than is normal for a company of its size.
In Summary...
Remuneration for Joe Raver is close enough to the median pay for a CEO of a similar sized company .
We feel that earnings per share have been a bit disappointing, but it's nice to see positive shareholder returns over the last three years. So we doubt many are complaining about the fairly normal CEO pay. CEO compensation is one thing, but it is also interesting to check if the CEO is buying or selling Hillenbrand (free visualization of insider trades).
Arguably, business quality is much more important than CEO compensation levels. So check out this free list of interesting companies, that have HIGH return on equity and low debt.
We aim to bring you long-term focused research analysis driven by fundamental data. Note that our analysis may not factor in the latest price-sensitive company announcements or qualitative material.
If you spot an error that warrants correction, please contact the editor at editorial-team@simplywallst.com. This article by Simply Wall St is general in nature. It does not constitute a recommendation to buy or sell any stock, and does not take account of your objectives, or your financial situation. Simply Wall St has no position in the stocks mentioned. Thank you for reading.
