
 Yahoo Finance
 Does General Mills, Inc. (NYSE:GIS) Have A Good P/E Ratio?

Today, we'll introduce the concept of the P/E ratio for those who are learning about investing. We'll apply a basic P/E ratio analysis to General Mills, Inc.'s (NYSE:GIS), to help you decide if the stock is worth further research. General Mills has a price to earnings ratio of 16.83, based on the last twelve months. That means that at current prices, buyers pay $16.83 for every $1 in trailing yearly profits.
Check out our latest analysis for General Mills
How Do I Calculate General Mills's Price To Earnings Ratio?
The formula for P/E is:
Price to Earnings Ratio = Share Price ÷ Earnings per Share (EPS)
Or for General Mills:
P/E of 16.83 = $52.56 ÷ $3.12 (Based on the year to August 2019.)
Is A High P/E Ratio Good?
The higher the P/E ratio, the higher the price tag of a business, relative to its trailing earnings. That isn't a good or a bad thing on its own, but a high P/E means that buyers have a higher opinion of the business's prospects, relative to stocks with a lower P/E.
How Does General Mills's P/E Ratio Compare To Its Peers?
The P/E ratio essentially measures market expectations of a company. If you look at the image below, you can see General Mills has a lower P/E than the average (24.8) in the food industry classification.
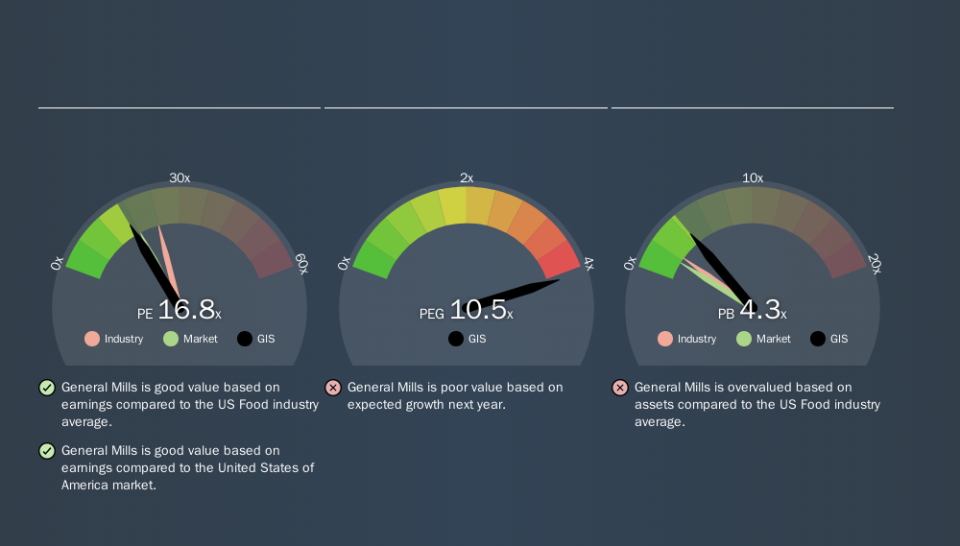
This suggests that market participants think General Mills will underperform other companies in its industry. Many investors like to buy stocks when the market is pessimistic about their prospects. It is arguably worth checking if insiders are buying shares, because that might imply they believe the stock is undervalued.
How Growth Rates Impact P/E Ratios
P/E ratios primarily reflect market expectations around earnings growth rates. Earnings growth means that in the future the 'E' will be higher. That means even if the current P/E is high, it will reduce over time if the share price stays flat. And as that P/E ratio drops, the company will look cheap, unless its share price increases.
General Mills's earnings per share fell by 14% in the last twelve months. But over the longer term (5 years) earnings per share have increased by 2.5%.
Remember: P/E Ratios Don't Consider The Balance Sheet
The 'Price' in P/E reflects the market capitalization of the company. So it won't reflect the advantage of cash, or disadvantage of debt. In theory, a company can lower its future P/E ratio by using cash or debt to invest in growth.
Such spending might be good or bad, overall, but the key point here is that you need to look at debt to understand the P/E ratio in context.
How Does General Mills's Debt Impact Its P/E Ratio?
Net debt is 43% of General Mills's market cap. You'd want to be aware of this fact, but it doesn't bother us.
The Verdict On General Mills's P/E Ratio
General Mills trades on a P/E ratio of 16.8, which is below the US market average of 18.2. The debt levels are not a major concern, but the lack of EPS growth is likely weighing on sentiment.
When the market is wrong about a stock, it gives savvy investors an opportunity. As value investor Benjamin Graham famously said, 'In the short run, the market is a voting machine but in the long run, it is a weighing machine. So this free visual report on analyst forecasts could hold the key to an excellent investment decision.
Of course you might be able to find a better stock than General Mills. So you may wish to see this free collection of other companies that have grown earnings strongly.
We aim to bring you long-term focused research analysis driven by fundamental data. Note that our analysis may not factor in the latest price-sensitive company announcements or qualitative material.
If you spot an error that warrants correction, please contact the editor at editorial-team@simplywallst.com. This article by Simply Wall St is general in nature. It does not constitute a recommendation to buy or sell any stock, and does not take account of your objectives, or your financial situation. Simply Wall St has no position in the stocks mentioned. Thank you for reading.
