
 Yahoo Finance
 What Does Gale Pacific Limited's (ASX:GAP) Balance Sheet Tell Us About It?

Want to participate in a short research study? Help shape the future of investing tools and you could win a $250 gift card!
While small-cap stocks, such as Gale Pacific Limited (ASX:GAP) with its market cap of AU$92m, are popular for their explosive growth, investors should also be aware of their balance sheet to judge whether the company can survive a downturn. Understanding the company's financial health becomes crucial, since poor capital management may bring about bankruptcies, which occur at a higher rate for small-caps. Let's work through some financial health checks you may wish to consider if you're interested in this stock. However, these checks don't give you a full picture, so I recommend you dig deeper yourself into GAP here.
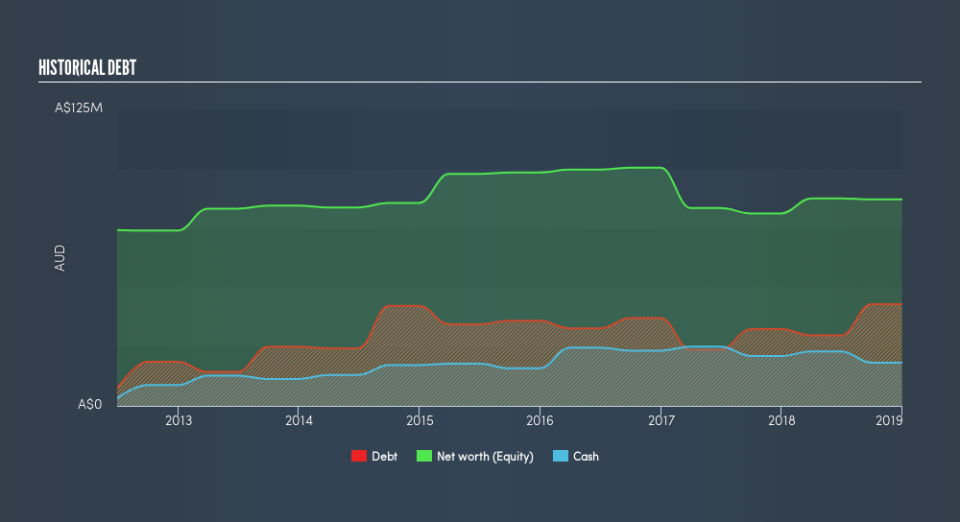
GAP’s Debt (And Cash Flows)
GAP's debt levels surged from AU$32m to AU$43m over the last 12 months – this includes long-term debt. With this rise in debt, the current cash and short-term investment levels stands at AU$18m , ready to be used for running the business. Moreover, GAP has produced cash from operations of AU$5.2m over the same time period, leading to an operating cash to total debt ratio of 12%, signalling that GAP’s operating cash is less than its debt.
Does GAP’s liquid assets cover its short-term commitments?
At the current liabilities level of AU$47m, it seems that the business has maintained a safe level of current assets to meet its obligations, with the current ratio last standing at 2.26x. The current ratio is calculated by dividing current assets by current liabilities. For Consumer Durables companies, this ratio is within a sensible range since there's a sufficient cash cushion without leaving too much capital idle or in low-earning investments.
Does GAP face the risk of succumbing to its debt-load?
GAP is a relatively highly levered company with a debt-to-equity of 49%. This is a bit unusual for a small-cap stock, since they generally have a harder time borrowing than large more established companies. No matter how high the company’s debt, if it can easily cover the interest payments, it’s considered to be efficient with its use of excess leverage. A company generating earnings before interest and tax (EBIT) at least three times its net interest payments is considered financially sound. In GAP's case, the ratio of 8.11x suggests that interest is appropriately covered, which means that lenders may be willing to lend out more funding as GAP’s high interest coverage is seen as responsible and safe practice.
Next Steps:
Although GAP’s debt level is towards the higher end of the spectrum, its cash flow coverage seems adequate to meet obligations which means its debt is being efficiently utilised. Since there is also no concerns around GAP's liquidity needs, this may be its optimal capital structure for the time being. I admit this is a fairly basic analysis for GAP's financial health. Other important fundamentals need to be considered alongside. I recommend you continue to research Gale Pacific to get a better picture of the small-cap by looking at:
Future Outlook: What are well-informed industry analysts predicting for GAP’s future growth? Take a look at our free research report of analyst consensus for GAP’s outlook.
Valuation: What is GAP worth today? Is the stock undervalued, even when its growth outlook is factored into its intrinsic value? The intrinsic value infographic in our free research report helps visualize whether GAP is currently mispriced by the market.
Other High-Performing Stocks: Are there other stocks that provide better prospects with proven track records? Explore our free list of these great stocks here.
We aim to bring you long-term focused research analysis driven by fundamental data. Note that our analysis may not factor in the latest price-sensitive company announcements or qualitative material.
If you spot an error that warrants correction, please contact the editor at editorial-team@simplywallst.com. This article by Simply Wall St is general in nature. It does not constitute a recommendation to buy or sell any stock, and does not take account of your objectives, or your financial situation. Simply Wall St has no position in the stocks mentioned. Thank you for reading.
