
 Yahoo Finance
 Does Energy World Corporation Ltd's (ASX:EWC) 34% Earnings Growth Make It An Outperformer?

Improvement in profitability and outperformance against the industry can be important characteristics in a stock for some investors. Below, I will assess Energy World Corporation Ltd's (ASX:EWC) track record on a high level, to give you some insight into how the company has been performing against its historical trend and its industry peers.
See our latest analysis for Energy World
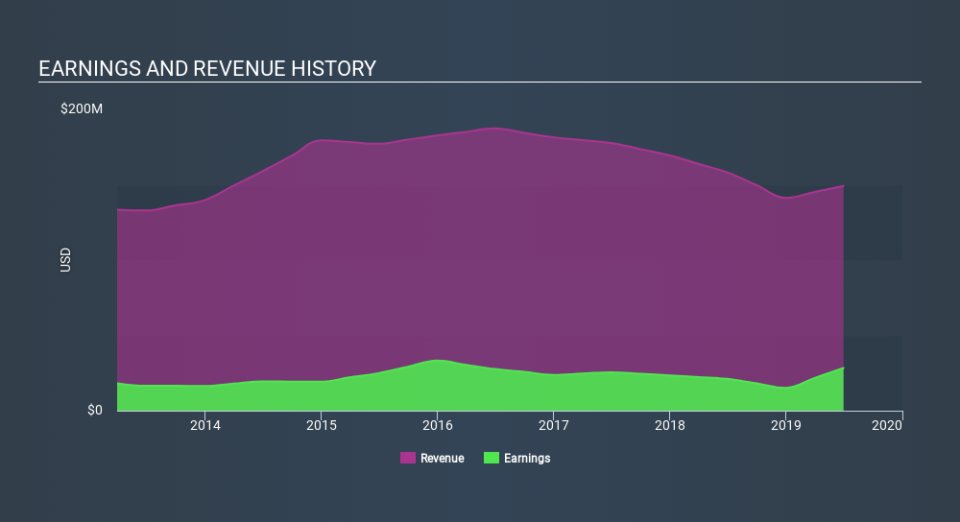
Did EWC beat its long-term earnings growth trend and its industry?
EWC's trailing twelve-month earnings (from 30 June 2019) of US$28m has jumped 34% compared to the previous year.
Furthermore, this one-year growth rate has exceeded its 5-year annual growth average of -1.5%, indicating the rate at which EWC is growing has accelerated. What's the driver of this growth? Let's see whether it is merely owing to industry tailwinds, or if Energy World has seen some company-specific growth.
In terms of returns from investment, Energy World has fallen short of achieving a 20% return on equity (ROE), recording 4.0% instead. Furthermore, its return on assets (ROA) of 1.7% is below the AU Renewable Energy industry of 5.4%, indicating Energy World's are utilized less efficiently. And finally, its return on capital (ROC), which also accounts for Energy World’s debt level, has declined over the past 3 years from 5.3% to 2.8%. This correlates with an increase in debt holding, with debt-to-equity ratio rising from 70% to 98% over the past 5 years.
What does this mean?
While past data is useful, it doesn’t tell the whole story. Companies that have performed well in the past, such as Energy World gives investors conviction. However, the next step would be to assess whether the future looks as optimistic. I recommend you continue to research Energy World to get a better picture of the stock by looking at:
Financial Health: Are EWC’s operations financially sustainable? Balance sheets can be hard to analyze, which is why we’ve done it for you. Check out our financial health checks here.
Other High-Performing Stocks: Are there other stocks that provide better prospects with proven track records? Explore our free list of these great stocks here.
NB: Figures in this article are calculated using data from the trailing twelve months from 30 June 2019. This may not be consistent with full year annual report figures.
If you spot an error that warrants correction, please contact the editor at editorial-team@simplywallst.com. This article by Simply Wall St is general in nature. It does not constitute a recommendation to buy or sell any stock, and does not take account of your objectives, or your financial situation. Simply Wall St has no position in the stocks mentioned.
We aim to bring you long-term focused research analysis driven by fundamental data. Note that our analysis may not factor in the latest price-sensitive company announcements or qualitative material. Thank you for reading.
