
 Yahoo Finance
 Does Compass Group PLC's (LON:CPG) Weak Fundamentals Mean That The Market Could Correct Its Share Price?
Most readers would already be aware that Compass Group's (LON:CPG) stock increased significantly by 21% over the past three months. We, however wanted to have a closer look at its key financial indicators as the markets usually pay for long-term fundamentals, and in this case, they don't look very promising. Particularly, we will be paying attention to Compass Group's ROE today.
Return on Equity or ROE is a test of how effectively a company is growing its value and managing investors’ money. In simpler terms, it measures the profitability of a company in relation to shareholder's equity.
See our latest analysis for Compass Group
How Do You Calculate Return On Equity?
ROE can be calculated by using the formula:
Return on Equity = Net Profit (from continuing operations) ÷ Shareholders' Equity
So, based on the above formula, the ROE for Compass Group is:
2.8% = UK£135m ÷ UK£4.8b (Based on the trailing twelve months to September 2020).
The 'return' refers to a company's earnings over the last year. Another way to think of that is that for every £1 worth of equity, the company was able to earn £0.03 in profit.
What Has ROE Got To Do With Earnings Growth?
Thus far, we have learned that ROE measures how efficiently a company is generating its profits. Based on how much of its profits the company chooses to reinvest or "retain", we are then able to evaluate a company's future ability to generate profits. Assuming all else is equal, companies that have both a higher return on equity and higher profit retention are usually the ones that have a higher growth rate when compared to companies that don't have the same features.
A Side By Side comparison of Compass Group's Earnings Growth And 2.8% ROE
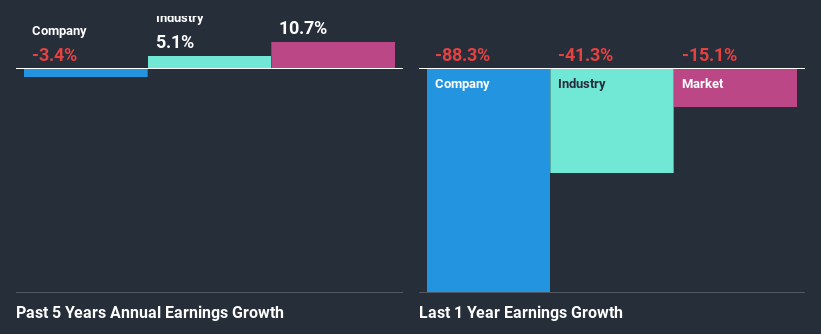
It is quite clear that Compass Group's ROE is rather low. Not just that, even compared to the industry average of 5.2%, the company's ROE is entirely unremarkable. For this reason, Compass Group's five year net income decline of 3.4% is not surprising given its lower ROE. We believe that there also might be other aspects that are negatively influencing the company's earnings prospects. For example, the business has allocated capital poorly, or that the company has a very high payout ratio.
That being said, we compared Compass Group's performance with the industry and were concerned when we found that while the company has shrunk its earnings, the industry has grown its earnings at a rate of 5.1% in the same period.
Earnings growth is an important metric to consider when valuing a stock. The investor should try to establish if the expected growth or decline in earnings, whichever the case may be, is priced in. This then helps them determine if the stock is placed for a bright or bleak future. Is Compass Group fairly valued compared to other companies? These 3 valuation measures might help you decide.
Is Compass Group Making Efficient Use Of Its Profits?
While the company did payout a portion of its dividend in the past, it currently doesn't pay a dividend. This implies that potentially all of its profits are being reinvested in the business.
Upon studying the latest analysts' consensus data, we found that the company is expected to keep paying out approximately 56% of its profits over the next three years. Regardless, the future ROE for Compass Group is predicted to rise to 22% despite there being not much change expected in its payout ratio.
Summary
On the whole, Compass Group's performance is quite a big let-down. The company has seen a lack of earnings growth as a result of retaining very little profits and whatever little it does retain, is being reinvested at a very low rate of return. That being so, the latest industry analyst forecasts show that the analysts are expecting to see a huge improvement in the company's earnings growth rate. Are these analysts expectations based on the broad expectations for the industry, or on the company's fundamentals? Click here to be taken to our analyst's forecasts page for the company.
This article by Simply Wall St is general in nature. It does not constitute a recommendation to buy or sell any stock, and does not take account of your objectives, or your financial situation. We aim to bring you long-term focused analysis driven by fundamental data. Note that our analysis may not factor in the latest price-sensitive company announcements or qualitative material. Simply Wall St has no position in any stocks mentioned.
Have feedback on this article? Concerned about the content? Get in touch with us directly. Alternatively, email editorial-team (at) simplywallst.com.
